An alternative to the alternative formulation of match tempo?
Categories: Match Quality Metrics, Team Performance
I see that my posts on match tempo have attracted a lot of attention and comments. Some of them disagree with my approach and/or ask some interesting questions. I don’t have a problem with that — the existence of critical comments indicates that people care enough about what your work to pose them.
One comment asked why my formulation of tempo had to include number of touches. It’s a good question — is the distance a ball travels more relevant that the number of feet it touched en route? Let’s consider that question now.
Starting from the assumptions in the previous post in this series, let’s redefine the match tempo as simply distance that the ball travels in a possession over the possession’s duration:
![]()
Units are quite simple: meters per second.
When we apply this formula to Opta’s 2010-11 English Premier League technical/tactical data, we see similar results to those obtained with the other tempo formula. First, here are the averaged match tempo figures for all of the teams:
| Team Name | Avg Tempo [m/s] | Std Tempo [m/s] |
| Bolton Wanderers | 8.25 | 0.70 |
| Stoke City | 8.13 | 0.85 |
| Everton | 8.01 | 0.72 |
| Blackpool | 7.90 | 0.62 |
| West Ham United | 7.84 | 0.61 |
| Birmingham City | 7.65 | 0.55 |
| Newcastle United | 7.46 | 0.65 |
| Tottenham Hotspur | 7.43 | 0.59 |
| Liverpool | 7.43 | 0.55 |
| Sunderland | 7.42 | 0.69 |
| Blackburn Rovers | 7.40 | 0.53 |
| Fulham | 7.38 | 0.61 |
| Wolverhampton Wanderers | 7.36 | 0.51 |
| Wigan Athletic | 7.15 | 0.53 |
| West Bromwich Albion | 7.15 | 0.60 |
| Aston Villa | 7.06 | 0.59 |
| Manchester City | 7.04 | 0.58 |
| Manchester United | 6.94 | 0.56 |
| Chelsea | 6.91 | 0.35 |
| Arsenal | 6.78 | 0.39 |
I’ll just say that I don’t have a lot of confidence in the standard deviations as currently calculated (from means of the match tempo for a club’s matches); this post on Wikipedia presents a better way to combine standard deviations. Aside from the two highest tempo sides and the four lowest tempo sides, there are significant changes in the results. Everton’s average match tempo is very high, but so is Tottenham’s. Blackburn’s tempo figures are now in the bottom half of the league, and the gap between the four low-tempo teams and the rest of the league is much smaller (Aston Villa’s figures are similar to Manchester City’s). But given the standard deviations it’s unlikely that we know exactly which clubs are high- or low-tempo sides, barring two or three sides on either side of the chart.
For comparison I show the chart that relates match possessions to match tempo. As in my other formulation of match tempo, there is a very slight relationship between tempo and number of possessions. One commenter in my previous post argued that the lack of relationship between tempo and possessions can be explained by the game plans of each team, and it is possible that sides such as Bolton and Stoke are employing very different strategies. One may have the ball a lot, and the other may have it very little, but when they do have it they choose to play it quickly more often than not.
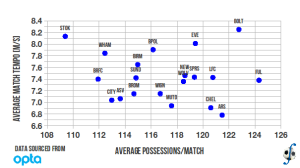
Relationship between averaged total number of possessions and averaged tempo in a match, English Premier League, 2010-11 season.
The next chart shows effective playing time versus match tempo. There’s a stronger relationship between the two variables than match tempo to number of possessions (R²=0.46), but it’s not as strong as the relationship between effective time and the other tempo formula. Weighting the average ball speed by the number of touches in the possession has the effect of compressing the tempo values toward an invisible trend line. The result is that is strengthens the relationship between match tempo and the dependent variable. One could see the same effect in the possessions vs tempo chart, but the relationship between both variables was very small.
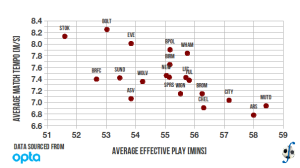
Relationship between averaged minutes of effective play and averaged tempo in a match, English Premier League, 2010-11 season.
So if this tempo metric means anything (and I’m not sure of that yet), teams like Stoke and Bolton played up-tempo when they were in possession, and the top four teams played much more deliberately than the rest of the league and involved more players in each possession. One objection is that match tempo is solely an offensive metric. True. But match tempo has always been an offensive metric, whether in basketball or football. One can look at how a team’s match tempo and total possessions change when they face an opponent.
What’s clear to me is that averaged measures of tempo or possession may not mean all that much away from the extremes. Yes, I’ve been harping about the use of averages in football analysis and here I am with a couple of posts that present averaged metrics. (“That what I know I should not do, I end up doing anyway.”) What’s most needed is a deep dive into a team’s matches to understand how often they played up- or down-tempo, and the type of pace they permitted or forced an opponent to play. I’m not sure that number of possessions is a good proxy for match tempo, and these results make me want to go a little deeper.
