An alternative formulation of tempo in football
Categories: Match Quality Metrics, Team Performance
A few weeks ago I wrote my thoughts on match tempo as it is currently defined in soccer. Essentially, the possessions per team metric, one borrowed from basketball, runs into some limitations when applied to football or other invasion sports conducted over a large playing area. This opinion is not a knock on other analysts who write about possessions in football; they are doing the best that they can with a limited dataset. Nevertheless in light of the growing availability of time- and space-stamped match data it’s time to update our formulation of match tempo and that’s what I’ll do here.
Preliminaries
I’ll start with a very idealized possession in soccer. A player starts a possession at a time and location on the pitch, and the ball moves between his teammates until the possession ends sometime in the future and somewhere else on the pitch. (I only consider possessions of two touches or more between teammates.)
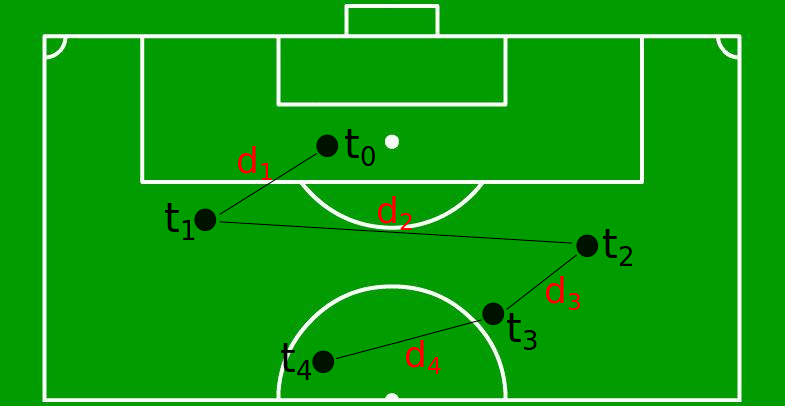
Schematic of ball touches that make up an idealized chain within a possession in a soccer match. Variable t represents timestamp of each touch, and d represents (x,y)-distance between consecutive touches.
I’ll be more precise about a possession. There are possessions that are interrupted by actions from the other team, such as a foul, a block, a deflection, or a goalkeeper action, but the original team maintained possession of the ball. These interruptions divide the possession into what I call chains — one of which I illustrate in the figure above.
Let’s say that there are k touches of the ball in a possession (summing all chains). Within each possession, the ball covers a distance d in a time t — d is the total distance along the ground that the ball travels between touches, and t is the total duration of the possession.
Defining Match Tempo
We have the quantities we need to define the speed of a possession — match tempo. We define match tempo as the speed of the ball’s movement relative to the number of touches:
![]()
The units for this definition of match tempo are meters per second per touch. (I’ll shorten the units to mpst for now until I think of a better unit — ’emps’ maybe?) I should also point out that this is the averaged tempo over a possession. We can get more precise by calculating the instantaneous derivative of ball position at every touch of the chain, but I’m not sure we need that level of detail, and we can put off those calculations for later.
We can use the above expression to determine average tempo over N possessions, up to the entire match:

Applying Match Tempo to Premier League Data
Okay, so enough of abstractions, let’s apply these ideas to something real! I’m going to return to my Opta F24 technical/tactical dataset for the 2010-11 English Premier League. I’ve integrated the Opta data into our match databases and implemented the match tempo formula into our library of match analytics routines.
Below is an infographic of average match tempo of all of the teams over all matches of the 2010-11 Premier League season. It makes for interesting viewing:
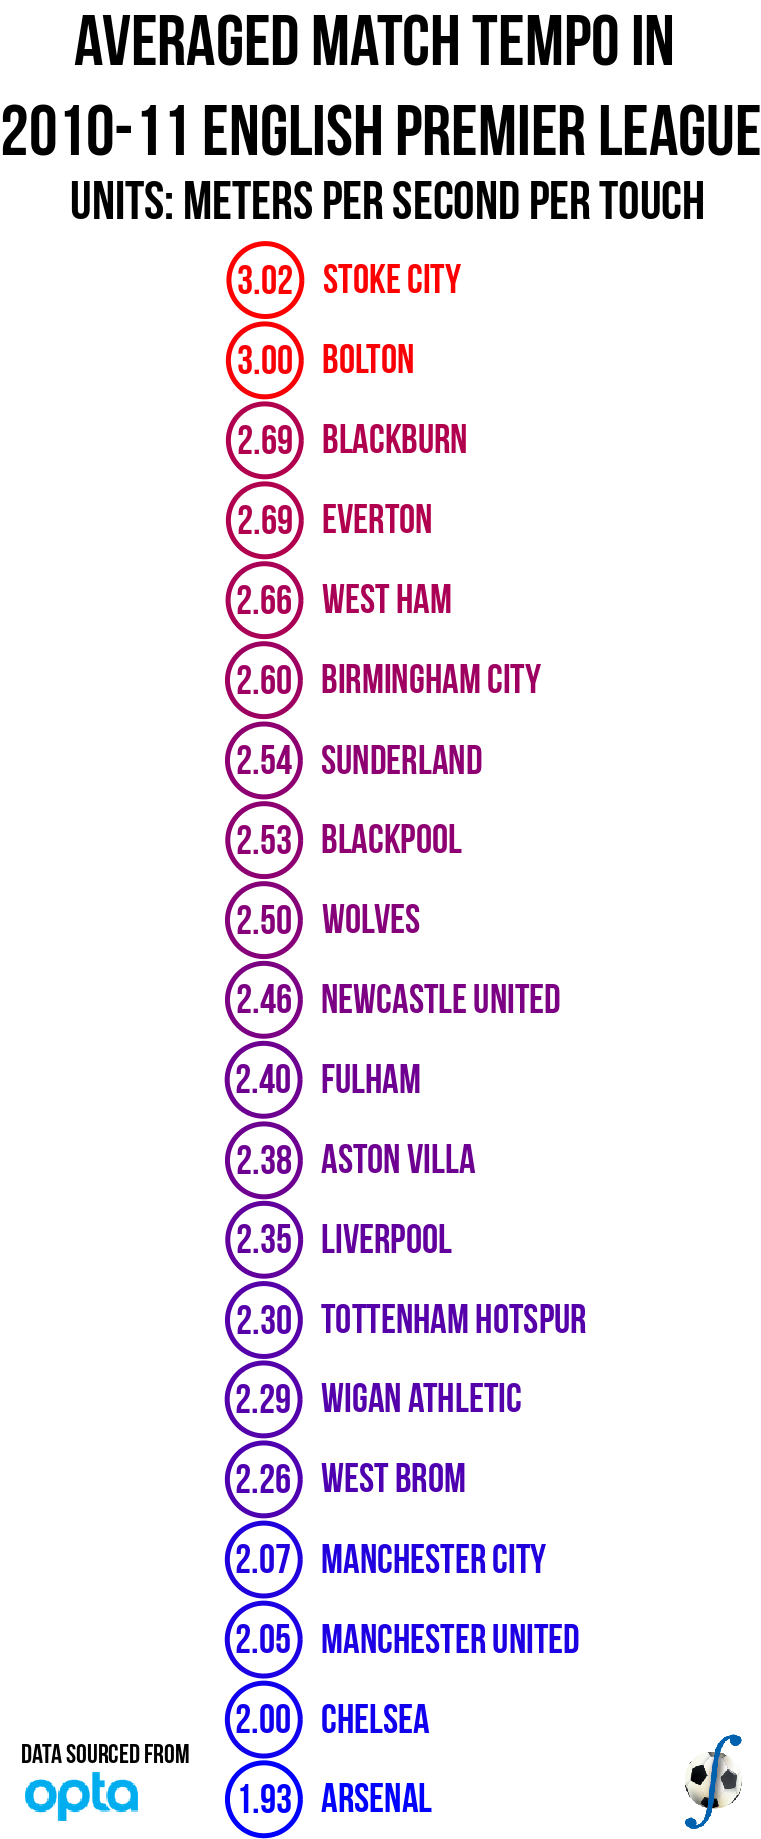
I believe it would surprise very few people upon learning that Stoke City and Bolton played the most high-tempo football in the Premier League two seasons ago. Stoke maintained that reputation under Tony Pulis, and Bolton had a similar record as well (I think that’s right; need to check their data). I do find it interesting that you could divide the 2010-11 Premier League into three groups:
- Stoke City and Bolton
- The top four — Manchester City, Manchester United, Chelsea, and Arsenal
- Everyone else
Most of the teams in the 2010-11 season moved their possessions at a rate of 2.5 m/s per touch– about 5.6 mph per touch for us Americans or 9.0 kph per touch for everyone else. Just for comparison, the average footballer moves at a rate of 6-8 kph or 3.7-5.0 mph. (This combines a lot of on-ball and off-ball activities in a match; we’d expect a player to run faster without the ball at his feet and a little slower with it.)
The top four finishers were in their own group, as they played their possessions at a much slower average rate than the rest of the league. Moreover the number of possessions varied significantly per team — Manchester United’s total possessions were close to league average and Chelsea and Arsenal enjoyed more possessions that most teams in the league, but Manchester City had close to the fewest. Stoke and Bolton were also in a group of their own, but they had the fewest average possessions of any side in the 2010-11 season.
One team that didn’t fit neatly in any group was Everton. During the 2010-11 season their match tempo was joint third-fastest in the league, yet they finished in the top ten of the league. Liverpool and Fulham, who finished above and below Everton in the standings, played about 0.3 m/s/touch slower than the Toffees. It’s a result that merits deeper analysis into Everton’s matches.
Is there a relationship between our formulation of match tempo and total number of possessions (the tempo expression borrowed from basketball) in the Premier League? The chart below, which plots average possessions in a match against average match tempo, appears to suggest against such a relationship. Bolton and Stoke occupy opposite corners of the chart — while both teams exhibit the highest match tempos in the 2010-11 season, Stoke enjoyed the fewest possessions in the league while Bolton had the second-most. The rest of the league were concentrated between 112-120 possessions per match and 1.9-2.7 mpst in a game. The coefficient of determination is very low at R² = 0.07.
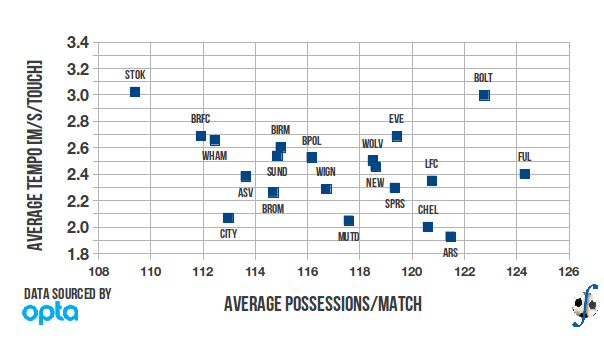
Relationship between averaged total number of possessions and averaged tempo in a match, English Premier League, 2010-11 season.
But is there a relationship between match tempo and effective playing time? The chart below seems to indicate a much stronger linear relationship between these two variables, and a coefficient of determination of R² = 0.75 would confirm that. In this case, it’s an inverse relationship — as the effective time of matches involving a team increases, that team’s match tempo will decrease. It appears that a faster-paced match would see the ball out of play more often than a slower and more deliberate style of play.

Relationship between averaged minutes of effective play and averaged tempo in a match, English Premier League, 2010-11 season.
I must reiterate that these charts present averaged match tempo — it can and does fluctuate significantly over the course of a match. But even at a higher-level view we can observe some differences in playing styles between clubs and relate them to other match quality metrics. In a future post I’ll dive into two matches to illustrate the differences in match tempo of both teams over the 90+ minutes of a match. One match will feature Stoke City, and the other the 2010-11 champions Manchester United.
