Superliga 2017/18 Review: Breaking down expected and actual results
Categories: Expected Goals, League Competitions
Throughout Argentina’s Superliga season I’ve presented two league tables side-by-side — one based on the actual league results, and an alternative table based on the expected goal scorelines. Here’s the final table:
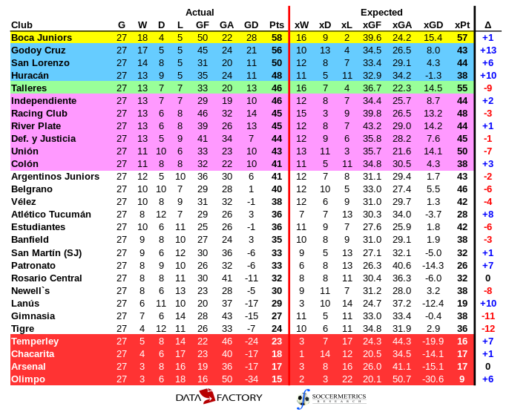
Final actual and expected league tables for Superliga Argentina, 2017-18 season. Data supplied by DataFactory LatAm.
(I color coded the outcome zones for the teams; yellow is for the league champion, blue goes to group stage of Copa Libertadores 2019, green goes to playoff round of Copa Libertadores 2019, purple represents berths to Copa Sudamericana 2019, and red represents relegation to Argentina’s Nacional B. And in Argentina, relegation is complicated, but that’s supposed to change in a few years.)
Displaying the two tables is well and good as it allows one to observe which teams are over- or under-performing their expected results based on the chances that they generate in a match. But what are the actual records in those matches where the team is expected to win, lose, or draw? I’ll examine that in this post and point out some interesting observations from the recently concluded Superliga.
One complicating issue of computing expected results is defining one. Expected goals are decimal values, yet draws are a part of the game, so one needs to determine a difference threshold between opposing goal values that would define wins, draws, and losses. I observed a season of actual and expected goals results in the Superliga and other top-flight leagues and selected the threshold that yielded the best correlation between actual and expected results. You can see the results here, but I decided on a threshold of 0.4 xG.
With thresholds decided upon, the table breakdown becomes an accounting exercise. I’ve ordered the Superliga sides by their final point totals with goal difference as the first tiebreaker. Results are broken out into results from expected wins, expected draws, and expected losses.
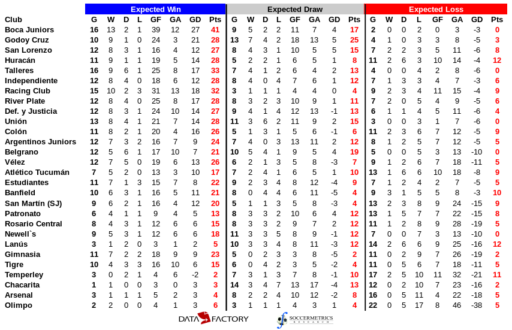
Breakdown of actual league table by expected results, Superliga Argentina, 2017-18 season. Data supplied by DataFactory LatAm.
If you examine the chart, three things reveal themselves very quickly:
- Superliga teams win the bulk of their matches when they generate significantly more chances than the opposing team.
- Matches in which both teams produce roughly the same amount of quality chances yield indifferent results.
- Superliga teams will lose most of the matches in which they create significantly fewer chances. No side has a positive goal difference in matches that they are expected to lose on xG.
You could probably extend these observations to other teams in other leagues and competitions. At the very least, it provides some confidence that something real is being captured by expected goals.
Returning to this season’s Superliga, Boca Juniors’ advantage in the title race came from their ability to generate more chances than their opponents in most of their matches, and most importantly, convert them. Boca and Talleres created significantly more scoring opportunities than their opponents in 16 of their 27 league matches. Boca won 13 of those matches, while Talleres could only win nine and drew six. The resulting eight-point difference was definitive in the championship. Racing created enough chances to win 15 times, yet lost all points three times. In the end those results made the difference between a Libertadores place and a berth in the Copa Sudamericana.
So how did Godoy Cruz emerge as a serious challenger? They had an insane record from matches that they were expected to draw. In those 13 matches in which Godoy Cruz were expected to draw, they won the most points (25), scored the most goals (18) and achieved the best goal difference (+5). They even managed to scrape a win from the four situations in which they were outplayed. They had an excellent record when they enjoyed the majority of quality chances, but those matches didn’t happen often enough for them to overhaul Boca’s lead.
The most impressive side in adverse situations was Huracán. They had an excellent record in those matches that they were expected to win, and they held their own in the five matches that were termed expected draws, but they won more points from matches where they had an xG disadvantage than any other Superliga side. Huracán were one of four sides who exceeded a 1.0 PPG in those matches that they were expected to lose (Banfield, San Lorenzo, and Racing were the others).
As one looks down the list, one observes the teams that regularly lost the chance creation fight and suffered for it. All of the sides in the lower 11 of the Superliga table had goal differences below -10 in those matches that they were expected to lose — eight matches won out of a collective 147 matches. Temperley did well in the matches that they were expected to lose, and Chacarita did fairly well in the matches that they were expected to draw, but it was at a clip of just under a point per match and they got slaughtered in matches under the remaining two scenarios.
There’s a lot more slicing to be done with the xG data, and I’ll continue that in future posts.
Data supplied by DataFactory Latinoamericano.
