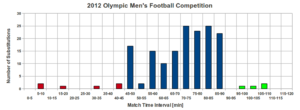
Substitution behaviors at the 2012 Olympic Men’s Football competition
Categories: Team Performance
We continue our retrospective of the Olympic Men’s football competition with a presentation of substitution patterns during the tournament. Substitutions were fewer and more defensive in nature than other national team tournaments this year, yet just as many goals were scored by substitutes in this competition.
We start with a distribution of the substitution events at the Olympics. Time segments are 5 minutes long for a total of 24 segments over the possible length of a soccer match. Stoppage time substitutions, of which there were five — one in the first half and five in the second.
There were 169 substitution events at the Olympic men’s competition, compared to 173 at the European Championships and 178 at the Africa Cup of Nations, for an average of 5.28 substitutions per match. As is often the case at international competitions, there is a large jump in substitutions at the start of the second half. If they aren’t made then, managers tend to wait until the 55-60 minute mark to start making changes, which they do with greater frequency until the end of regulation time. In similar fashion to the Africa Cup of Nations and European Championships, substitutions peak between minutes 80 and 85, but these are more than likely second or third substitutions. The rate of substitutions crashes during the extra time periods, most likely due to the lack of available subs on either side. Only four subs were made in extra time.
Who is subbed for whom in the Olympics? Substitutions in the group phase were like-for-like, and midfielders are swapped in and out more than any other position. But in contrast to the Euros, substitutions resulted in a net increase in the number of defenders on the field. The table below displays the default positions of players involved on either side of a substitution event (I switched the in/out colors so that they make sense).
| Player Out | ||||||
| Goalkeeper | Defender | Midfielder | Striker | |||
| Player In | Goalkeeper | 1 | 0 | 0 | 0 | 1 |
| Defender | 0 | 10 | 16 | 7 | 33 | |
| Midfielder | 0 | 6 | 43 | 23 | 72 | |
| Striker | 0 | 7 | 22 | 34 | 63 | |
| 1 | 23 | 81 | 64 | |||
The number of strikers in the match remained the same, but midfielders were repeatedly swapped out for defenders. In fact, 16 midfielders were replaced by a defender.
There have been twelve goals scored by a substitute, and below is a list of all of them:
| Scorelines | ||||||
| Substitute | Country | Sub Time | Goal Time | At Sub | At Goal | Final |
| Nicolás Lodeiro | Uruguay | 46 | 56 | 1-1 | 2-1 | 2-1 |
| Mohamed Salah | Egypt | 46 | 76 | 0-3 | 2-3 | 2-3 |
| Daniel Sturridge | England | 46 | 76 | 1-0 | 3-1 | 3-1 |
| Scott Sinclair | England | 72 | 73 | 1-1 | 2-1 | 3-1 |
| Giovani dos Santos | Mexico | 46 | 63 | 0-0 | 1-0 | 2-0 |
| Giovani dos Santos | Mexico | 46 | 90+2 | 0-0 | 2-0 | 2-0 |
| Marwan Mohsen | Egypt | 46 | 73 | 0-0 | 2-0 | 3-1 |
| Andrey Varankow | Belarus | 69 | 87 | 0-1 | 1-3 | 1-3 |
| Héctor Herrera | Mexico | 75 | 109 | 2-1 | 4-2 | 4-2 |
| Ibrahima Baldé | Senegal | 60 | 76 | 0-1 | 2-2 | 2-4 |
| Javier Cortés | Mexico | 90 | 90+3 | 2-1 | 3-1 | 3-1 |
| Hulk | Brazil | 32 | 90+1 | 0-1 | 1-2 | 1-2 |
Below are the positions that these players replaced. A couple more goals were scored by midfielders, but two more were also scored by strikers.
| Player Out | ||||||
| Goalkeeper | Defender | Midfielder | Striker | |||
| Player In | Goalkeeper | 0 | 0 | 0 | 0 | 0 |
| Defender | 0 | 0 | 0 | 0 | 0 | |
| Midfielder | 0 | 1 | 3 | 0 | 4 | |
| Striker | 0 | 4 | 1 | 3 | 8 | |
| 0 | 5 | 4 | 3 | |||
So once again, the substitutions during the Olympics were more defensive (judging from default position) and the average number of goals was lower than that of other tournaments this summer. But more substitutes had a greater impact on the scoreline than in other competitions.


