Ball (not) in play: Effective time in football
Categories: Match Quality Metrics, Team Performance
In my previous post on match tempo, I presented a chart that compared final league position to average possessions per game and average effective time in a match. It was rude of me to introduce a term and not define it, much less discuss it, so I’ll do so now.
I’ve been fascinated by the idea of “effective time” since I first saw the “gioco effettivo” statistic on RAI broadcasts of Serie A matches in the 1990s. I define effective time as the total amount of time that the ball is in play in the match, after removing all stoppages due to fouls, ball outs, corners, substitutions, injuries, goals, and so forth. I like this metric because it expresses the amount of flow in a football match. It takes some skill on the part of both teams to have a match with close to 70 minutes of effective playing time, or 40 minutes for that matter if one team is acting as destroyer.
(Quick aside here: people new to soccer believe that the objective of “stoppage time” is to recover time due to stoppages. It’s partially correct in terms of recovery of time lost due to goals, substitutions, injuries, and ejections, but stoppage time isn’t designed to recover time from the two events which result in the greatest loss of time: ball outs and fouls.)
At Soccermetrics, we compute effective play from technical/tactical data by stepping through all match events in chronological order and identifying the periods of continuous play (ball out of play corresponding to a stoppage event, and ball in play everything else). We model the transitions between ball in/out of play with a state diagram:
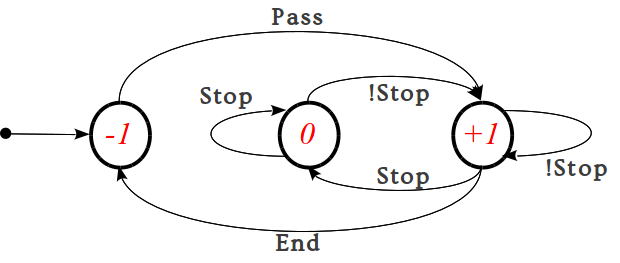
State diagram of effective play in a football match. State +1 is ball in play, State 0 is ball out of play, and State -1 is match stopped. Arrows designate flows between and within states.
Let’s illustrate this concept with results from the 2010-11 English Premier League. We implemented the above state diagram into a software routine within our analytics library and processed the technical/tactical Opta data to compute total effective time. (We’ve also broken it down by half, but we’ll display results for the full match.)
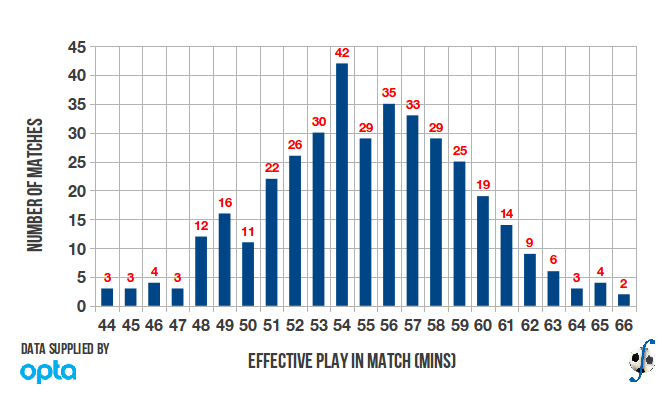
Distribution of effective playing time in the English Premier League, 2010-11 season.
Effective time varied between 44 and 66 minutes in the 2010-11 season, centered about a mean effective playing time of 55 minutes 6 seconds. Three matches had the least amounts of effective time:
- Blackburn Rovers vs Stoke City (Matchday 19)
- Sunderland vs Newcastle United (Matchday 23)
- Stoke City vs Sunderland (Matchday 26)
Two matches saw the highest amounts of effective time:
- Manchester United vs Wolves (Matchday 11)
- Arsenal vs Liverpool (Matchday 33)
(Probably not a surprise to many that Stoke were involved in two of the three matches where the ball was in play the least.)
So is there a relationship between average effective playing time in matches involving a team and its average total possessions? Not really. The plot below displays the average effective playing time against average possessions per match.
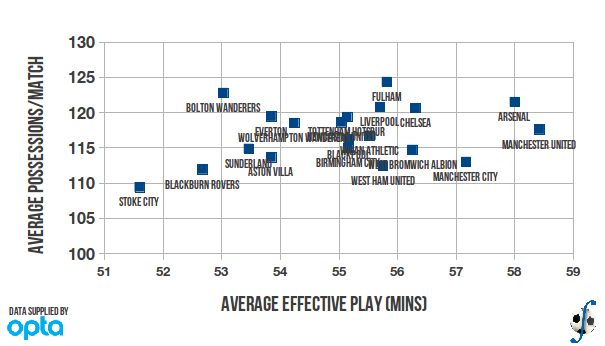
Average effective playing time versus average possessions per match in English Premier League, 2010-11 season.
While there are some teams who are where you expect them (Stoke and Blackburn have the fewest possessions and are involved in matches with the least amount of effective playing time, and Arsenal and Manchester United are on the opposite end of the spectrum), in the middle there is a mass of clubs.
For example, Bolton were involved in matches where the average effective time was below the league average, and they had more possessions per match than any side except Fulham. Manchester City’s matches had the highest effective time than any team other than Arsenal and United, yet their possessions per match were on the order of Aston Villa and Blackburn Rovers. No wonder the R² value for this relationship was 0.10.
I believe that what these observations show is that different teams have different objectives for winning points from matches, whether it’s smooth, slick passing where the ball rarely crosses the touchlines, or play that seeks to win the ball from touch, draw fouls, and create scoring chances from set-pieces. From the team perspective, effective playing time may not mean all that much. For the public and the media, however, effective time has greater resonance because it serves as a proxy for entertainment value.
