Chances created and converted in Argentina’s Primera División 2016-17
Categories: Expected Goals, Team Performance
Argentina’s Primera División 2016-17 has been a study of constants and fluidity since it began last August. Boca Juniors have led the tournament since December, but at least two and as many as five other sides have appeared as credible challengers to the title. Some teams should have been stronger challengers but haven’t (Racing Club), and others should have been toiling in mid-table instead of flirting with the top (Newell’s and to an lesser extent Colón). All of the teams have created scoring opportunities to varying degrees, and their conversion rate (or lack thereof) has made the difference between fighting for the title, missing out on a South American place, or fending off the dreaded relegation average.
To examine the differences in performance, I visualize for each team the average number of expected goals created or allowed against the rate of shots that are converted into goals. I consider only those shots that came from open play or set-pieces.
The first scatter plot shows xG created per game and the shot conversion rate:
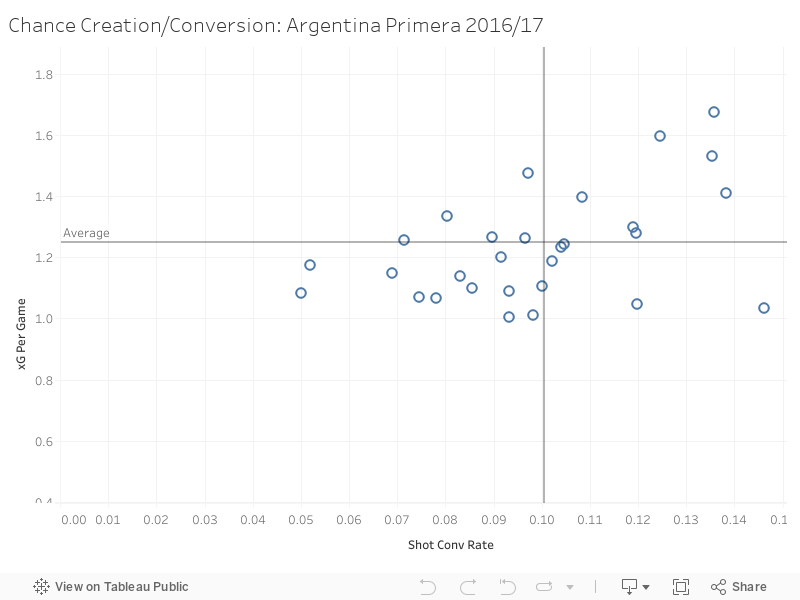
The reference lines in both plots display the league averages of xG per game and shot conversion rate. The lines split the space into convenient quadrants, which I describe in clockwise order:
- xG and shot conversion above league average (the league leaders and contenders for Libertadores places)
- xG below league average, shot conversion above league average (the most interesting teams are further away from the intersection)
- xG and shot conversion below league average (bottom of the table teams — these may not necessarily be relegation-threatened because of Argentina’s league rules)
- xG above league average, shot conversion below league average (teams are more likely to hug the reference lines here)
So as you would expect, Boca Juniors are way in the uppermost part of the first quadrant. No other team comes close to them in terms of expected goals created or shot conversion from open play. Other teams further out in the quadrant, such as Estudiantes, River, San Lorenzo, and Racing have challenged for the top spot, but Boca have continued to maintain a healthy distance from them.
The really interesting teams are the outlying sides in the second quadrant. Lanús and Newell’s Old Boys have xGs that are among the lowest in the division, but their shot conversion rates are well above the league average. This is especially true for Newell’s, whose shot conversion rate is second only to Boca.
The second scatter plot shows xG allowed per game and the opposing shot conversion rate:

As in the reference lines in both plots display the league averages of xG per game and shot conversion rate, which split the space into the following quadrants, which I describe in clockwise order:
- xG and shot conversion allowed above league average (bottom of the table and/or relegation-threatened teams)
- xG allowed below league average, shot conversion above league average (the most interesting teams are further away from the lines)
- xG and shot conversion allowed below league average (the league leaders and contenders for Libertadores places)
- xG allowed above league average, shot conversion allowed below league average (more often than not mid-table teams)
Again, as you would expect, Boca Juniors are well within the third quadrant with the lowest xG allowed per game and one of the lowest shot conversion rates allowed. Arsenal of Sarandí are well within the dreaded first quadrant of above-average xG and shot conversion allowed. Little wonder that they are facing relegation. The most interesting teams in terms of analysis appear to be Racing Club and Vélez Sarsfield, who have allowed a low rate of expected goals but a very high conversion rate of opposing shots.
All data in the competition is from DataFactory LatAm.
