What is the best way to model expulsions in a plus/minus model?
Categories: Player Performance
In my post a couple of weeks back on adjusted plus/minus, I said that I wasn’t comfortable with the idea of zeroing out the appearance index for players who were sent off in a football match, but hadn’t come up with a suitable alternative. I’ve arrived upon an alternative now, so I’ll update the model and see if it makes any difference in the plus/minus results.
Adjusted Plus/Minus Model with Player Expulsions
Let’s recall the adjusted plus/minus model:
\[
90\frac{\Delta G}{M_j} = \alpha_0 + \alpha_1 x_1 + \alpha_2 x_2 + \ldots + \alpha_i x_i + \ldots + \alpha_N x_n + e
\]
which has the following terms:
- \(\Delta G\): Goal margin, \(G_{home} – G_{away}\)
- \(M_j\): Length of time segment, the interval in which no substitutions or expulsions occurred, for \(j = 1, \ldots, R\) segments [in minutes]
- \(\alpha_0\): Average home advantage in competition
- \(\alpha_i\): Influence of player \(i\) on goal differential, for \(i = 1, \ldots, N\) players in competition
- \(x_i\): Player appearance index:
- +1: Player \(i\) is playing at home
- 0: Player \(i\) is not playing
- -1: Player \(i\) is playing away
I model expulsions by extending conditions for the player appearance index. The concept is this:
- An expelled player is treated as if he is on the field if his team is scored against in subsequent match segments, but ignored if his team manages to score without him.
- If a teammate is also sent off, the same treatment applies to both players.
- If a player on the opposing team is sent for an early bath, I ignore the earliest expulsion on the other team.
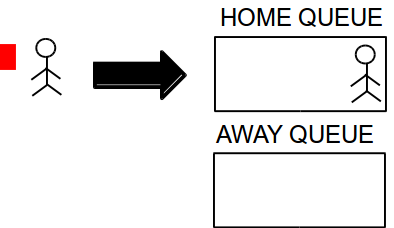
One way to visualize this in a way that makes sense (at least to me) is through two queues, which I call penalty queues. Here is a very rough schematic of what happens when a player from the home team is sent off:
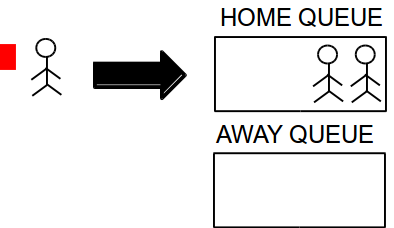
Here’s what happens when the player’s teammate also sees red (bullet #2). He is also pushed into the penalty queue:
Say this has been a really bad-tempered match, and a player from the away side gets a second booking (bullet #3). That player is pushed into the away team’s penalty queue, but the first player in the home team penalty queue is removed (or ‘popped’ in queue terminology):
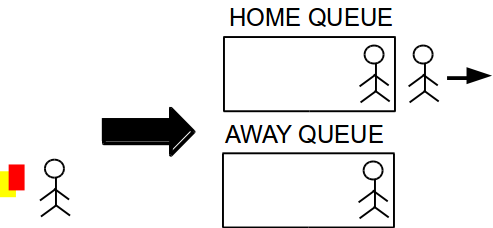
Players in these queues for any segment of the match are given appearance indices of +1 or -1 only if their team has a negative goal difference during that segment. If their team has a zero or positive goal difference, they are given an appearance index of 0.
Adjusted Plus/Minus Results: 2011-12 English Premier League
Let’s demonstrate the new adjusted plus/minus model on the same match data I used in my previous post: the 2011-12 English Premier League. The modeling procedures are the same, so if you want to find more details consult that post at this link.
For reference, here are the top twenty players (minimum playing time 900 minutes) in terms of adjusted plus/minus — each player’s contribution to his team’s scoring margin over 90 minutes — using the original model:
| Name | Default Position | Mins | APM/90 |
| Jonny Evans | Defender | 2430 | 1.067 |
| Leon Best | Striker | 1163 | 0.800 |
| James Perch | Defender | 1359 | 0.714 |
| Michael Williamson | Defender | 1916 | 0.689 |
| Mikel Arteta | Midfielder | 2606 | 0.572 |
| Thomas Vermaelen | Defender | 2506 | 0.539 |
| Edin Džeko | Striker | 1513 | 0.518 |
| Lucas Leiva | Central Midfielder | 1047 | 0.492 |
| Alexandre Song | Midfielder | 3018 | 0.481 |
| Ashley Young | Midfielder | 1572 | 0.463 |
| Danny Murphy | Central Midfielder | 2731 | 0.444 |
| Chris Smalling | Central Defender | 1301 | 0.442 |
| Emmanuel Adebayor | Striker | 2844 | 0.429 |
| David Vaughan | Central Midfielder | 1496 | 0.428 |
| Gaël Clichy | Left Full-back | 2527 | 0.424 |
| Ryan Giggs | Midfielder | 1480 | 0.422 |
| James Milner | Midfielder | 1587 | 0.408 |
| Steven Caulker | Defender | 2342 | 0.406 |
| André Santos | Left Full-back | 1021 | 0.398 |
| Ledley King | Central Defender | 1807 | 0.389 |
And here are the top twenty players (minimum playing time 900 minutes) in terms of APM augmented with the player expulsion model:
| Name | Default Position | Mins | APM/90 |
| Jonny Evans | Defender | 2430 | 1.070 |
| Leon Best | Striker | 1163 | 0.814 |
| James Perch | Defender | 1359 | 0.722 |
| Michael Williamson | Defender | 1916 | 0.700 |
| Mikel Arteta | Midfielder | 2606 | 0.559 |
| Edin Džeko | Striker | 1513 | 0.534 |
| Thomas Vermaelen | Defender | 2506 | 0.524 |
| Lucas Leiva | Central Midfielder | 1047 | 0.491 |
| Alexandre Song | Midfielder | 3018 | 0.468 |
| Ashley Young | Midfielder | 1572 | 0.449 |
| Gaël Clichy | Left Full-back | 2527 | 0.444 |
| Danny Murphy | Central Midfielder | 2731 | 0.441 |
| Chris Smalling | Central Defender | 1301 | 0.427 |
| Emmanuel Adebayor | Striker | 2844 | 0.427 |
| David Vaughan | Central Midfielder | 1496 | 0.426 |
| James Milner | Midfielder | 1587 | 0.412 |
| Ryan Giggs | Midfielder | 1480 | 0.407 |
| Steven Caulker | Defender | 2342 | 0.401 |
| André Santos | Left Full-back | 1021 | 0.399 |
| Paul Scholes | Midfielder | 1170 | 0.395 |
The effect of the augmented APM model on the test data RMSE is minimal: adding player expulsions adds about 0.5% to the variance in the goal difference data that is explained by the model. The average home advantage is relatively unchanged from +0.390 goals per 90 minutes to +0.388 goals per 90 minutes. About 80% of the players see their APM change by 0.01 goals per 90 minutes, which translates to a shift in rank of about four places. So a majority of players don’t see any difference to their APM ratings.
That leaves about 20% — 60 players — whose APMs change by more than 0.01 goals per 90 minutes, which often results in significant changes relative to their peers. Here are the 30 players whose APMs increase by 0.01:
| Name | Default Position | Mins | APM/90 | Rank | APM/90 (Exp) | Rank (Exp) | Diff APM | Diff Rank |
| Joey Barton | Midfielder | 2855 | 0.061 | 141 | 0.126 | 102 | 0.065 | 39 |
| Daniel Gabbidon | Defender | 1423 | 0.047 | 150 | 0.102 | 116 | 0.055 | 34 |
| Shaun Wright-Phillips | Right Winger | 2214 | -0.357 | 310 | -0.310 | 302 | 0.047 | 8 |
| Jamie Mackie | Striker | 2189 | -0.236 | 293 | -0.191 | 275 | 0.045 | 18 |
| Anton Ferdinand | Defender | 3024 | 0.098 | 117 | 0.130 | 99 | 0.032 | 18 |
| Bobby Zamora | Striker | 2386 | 0.189 | 74 | 0.221 | 61 | 0.032 | 13 |
| Nedum Onuoha | Defender | 1461 | 0.043 | 153 | 0.074 | 134 | 0.031 | 19 |
| Luke Young | Defender | 2172 | 0.095 | 119 | 0.124 | 104 | 0.029 | 15 |
| Alejandro Faurlín | Midfielder | 1799 | -0.159 | 271 | -0.130 | 257 | 0.029 | 14 |
| Samir Nasri | Midfielder | 2260 | 0.085 | 125 | 0.112 | 111 | 0.027 | 14 |
| Taye Taïwo | Left Full-back | 1204 | 0.065 | 138 | 0.088 | 123 | 0.023 | 15 |
| Gaël Clichy | Left Full-back | 2527 | 0.424 | 15 | 0.444 | 11 | 0.020 | 4 |
| Nigel de Jong | Midfielder | 1081 | -0.568 | 326 | -0.548 | 324 | 0.020 | 2 |
| Adel Taarabt | Midfielder | 2016 | 0.112 | 108 | 0.132 | 98 | 0.020 | 10 |
| Micah Richards | Right Full-back | 2050 | 0.309 | 34 | 0.328 | 30 | 0.019 | 4 |
| Joe Hart | Goalkeeper | 3430 | 0.151 | 93 | 0.168 | 83 | 0.017 | 10 |
| Davide Santon | Left Full-back | 1672 | 0.270 | 41 | 0.287 | 38 | 0.017 | 3 |
| Edin Džeko | Striker | 1513 | 0.518 | 7 | 0.534 | 6 | 0.016 | 1 |
| David Silva | Midfielder | 2809 | 0.180 | 78 | 0.195 | 71 | 0.015 | 7 |
| Clint Hill | Central Defender | 1709 | -0.288 | 300 | -0.273 | 296 | 0.015 | 4 |
| Pablo Zabaleta | Right Full-back | 1555 | -0.486 | 321 | -0.471 | 320 | 0.015 | 1 |
| Leon Best | Striker | 1163 | 0.800 | 2 | 0.814 | 2 | 0.014 | 0 |
| Zak Whitbread | Central Defender | 1449 | -0.109 | 249 | -0.096 | 237 | 0.013 | 12 |
| Adam Drury | Defender | 909 | 0.123 | 101 | 0.135 | 96 | 0.012 | 5 |
| Vincent Kompany | Central Defender | 2779 | 0.299 | 35 | 0.311 | 35 | 0.012 | 0 |
| Ákos Buzsáky | Midfielder | 902 | 0.041 | 155 | 0.053 | 145 | 0.012 | 10 |
| Mario Balotelli | Striker | 1348 | 0.213 | 63 | 0.224 | 57 | 0.011 | 6 |
| Paul Scholes | Midfielder | 1170 | 0.384 | 22 | 0.395 | 20 | 0.011 | 2 |
| Michael Williamson | Defender | 1916 | 0.689 | 4 | 0.700 | 4 | 0.011 | 0 |
| Jay Bothroyd | Striker | 1103 | 0.027 | 161 | 0.038 | 153 | 0.011 | 8 |
It’s probably more than a little amusing that the player most helped by incorporating expulsions into an adjusted plus/minus rating is Joey Barton. But if you look at his disciplinary record, he was sent off two times during the 2011-12 season. QPR’s goal difference in his absence wasn’t good — goal differential of -3 — but that doesn’t seem to be a difference-maker. QPR had a man advantage just one time in 2011-12, at home to Chelsea in an exceptionally bad-tempered match on 23 October 2011, but they had already scored their goal when they went one and later two men up. Daniel Gabbidon, who also played for QPR that season, also has a large shift in his APM, but he was used sparingly during the season. It’s not clear what accounts for the large change in Joey Barton’s APM, and I will have to dig through the numbers to find out.
A look at the 31 players whose APMs decrease by 0.01 goals per 90 minutes is even more interesting:
| Name | Default Position | Mins | APM/90 | Rank | APM/90 (Exp) | Rank (Exp) | Diff APM | Diff Rank |
| Shaun Derry | Midfielder | 2240 | -0.025 | 194 | -0.036 | 199 | -0.011 | -5 |
| Kieran Richardson | Left Winger | 2291 | -0.091 | 238 | -0.102 | 240 | -0.011 | -2 |
| David de Gea | Goalkeeper | 2618 | 0.206 | 65 | 0.195 | 70 | -0.011 | -5 |
| Dean Whitehead | Central Midfielder | 2383 | 0.101 | 115 | 0.090 | 121 | -0.011 | -6 |
| Ivan Klasnić | Striker | 1521 | 0.072 | 131 | 0.061 | 141 | -0.011 | -10 |
| Fernando Torres | Striker | 1920 | 0.042 | 154 | 0.030 | 156 | -0.012 | -2 |
| Antolín Alcaraz | Central Defender | 2198 | -0.220 | 285 | -0.232 | 289 | -0.012 | -4 |
| Demba Ba | Striker | 2756 | -0.091 | 237 | -0.103 | 242 | -0.012 | -5 |
| Nicky Shorey | Left Full-back | 2019 | -0.126 | 259 | -0.138 | 264 | -0.012 | -5 |
| Alexandre Song | Midfielder | 3018 | 0.481 | 9 | 0.468 | 9 | -0.013 | 0 |
| Sebastian Larsson | Midfielder | 2712 | -0.110 | 250 | -0.123 | 254 | -0.013 | -4 |
| Jason Lowe | Midfielder | 2689 | -0.060 | 217 | -0.073 | 223 | -0.013 | -6 |
| Wayne Rooney | Central Forward | 2845 | 0.012 | 177 | -0.001 | 178 | -0.013 | -1 |
| Mikel Arteta | Midfielder | 2606 | 0.572 | 5 | 0.559 | 5 | -0.013 | 0 |
| Phil Jones | Defender | 2112 | -0.354 | 309 | -0.367 | 310 | -0.013 | -1 |
| Ashley Young | Midfielder | 1572 | 0.463 | 10 | 0.449 | 10 | -0.014 | 0 |
| Javier Hernández | Striker | 1500 | -0.215 | 283 | -0.229 | 287 | -0.014 | -4 |
| Ryan Giggs | Midfielder | 1480 | 0.422 | 16 | 0.407 | 17 | -0.015 | -1 |
| Darren Pratley | Midfielder | 1289 | -0.106 | 246 | -0.121 | 252 | -0.015 | -6 |
| Chris Smalling | Central Defender | 1301 | 0.442 | 12 | 0.427 | 13 | -0.015 | -1 |
| Thomas Vermaelen | Defender | 2506 | 0.539 | 6 | 0.524 | 7 | -0.015 | -1 |
| Jamie O’Hara | Midfielder | 1659 | 0.203 | 67 | 0.188 | 74 | -0.015 | -7 |
| Steven Taylor | Defender | 1279 | -0.292 | 301 | -0.308 | 301 | -0.016 | 0 |
| Park Ji-Sung | Midfielder | 939 | 0.388 | 21 | 0.372 | 23 | -0.016 | -2 |
| Stephen Kelly | Right Full-back | 2029 | -0.542 | 324 | -0.558 | 326 | -0.016 | -2 |
| Ramires | Central Midfielder | 2480 | 0.175 | 82 | 0.159 | 91 | -0.016 | -9 |
| Danny Welbeck | Central Forward | 2022 | -0.223 | 287 | -0.240 | 292 | -0.017 | -5 |
| Luis Suárez | Striker | 2556 | -0.088 | 235 | -0.105 | 243 | -0.017 | -8 |
| Kenwyne Jones | Striker | 986 | -0.026 | 196 | -0.044 | 203 | -0.018 | -7 |
| Emile Heskey | Striker | 1454 | 0.029 | 158 | 0.011 | 173 | -0.018 | -15 |
| Kyle Naughton | Right Full-back | 2736 | -0.183 | 277 | -0.201 | 276 | -0.018 | 1 |
| Per Mertesacker | Central Defender | 1830 | 0.253 | 48 | 0.234 | 52 | -0.019 | -4 |
| Damien Duff | Right Winger | 2118 | 0.262 | 44 | 0.243 | 46 | -0.019 | -2 |
| Gareth Barry | Central Midfielder | 2738 | 0.024 | 165 | -0.225 | 285 | -0.249 | -120 |
| Armand Traoré | Left Full-back | 1713 | 0.256 | 46 | -0.311 | 303 | -0.567 | -257 |
For the large majority of players, a drop in APM by 0.01 goals per 90 minutes isn’t going to matter all that much; over a season with 2500 league minutes played the change in APM represents an impact of about -0.45 goals. But there are a couple of players with significant changes in APM that moved them to opposite ends of the table. Gareth Barry, who played for Manchester City in 2011-12, saw his rating drop from a mid-table position to the lower end of the APM table. Armand Traoré, a left back for QPR, saw his rating drop by over half a goal per 90 minutes, which sent him almost to the bottom of the table. Both players require further examination.
As I said in my previous post, it’s just one league season, so there is a lot of noise and multicollinearity that a Tikhonov regularization can’t reduce on its own. It would be interesting and vital to examine how these ratings behave with two or three more years of match segment data. As for the player expulsion model, it’s nice to have it so that I can say that I’ve accounted for expulsions, but the results don’t appear to say that it’s necessary for improved modeling. We’ll just have to wait and see until we get more data.
