Does centering illuminate team effects on effective time in football matches?
Categories: Match Quality Metrics
First of all, Happy New Year to all our readers! I wish you all a productive, healthy, and happy 2014.
I want to continue some work that I was working on last year — 24 hours ago, in fact. In my previous post I conducted a regression analysis of team effects on the amount of time that the ball is in play in an English Premier League season. The results were for the most part as expected; most of the teams that finished in the top four had the largest impacts on effective time, while the two clubs most suspected of playing a style to induce more set-piece opportunities has the smallest. The relationship between effective time impact and average match tempo is quite strong, which wasn’t surprising.
The results, while illuminating to a degree, didn’t provide the complete insight that I was looking for. When I thought of performing a regression analysis, I wanted to be able to distinguish the sides that, on balance, added to the amount of effective time in a match from those sides that, on balance, tended to subtract from it. There is a technique that would have helped me address that objective. It is mean centering, and I’ll present results in this post.
Mean centering is the practice of subtracting means from a regression variable. It’s typically performed on the independent variables (regressors) but can be done on dependent (response) variables as well. In this case I subtract the mean effective time from the effective time of every Premier League match, so that the regression coefficient represents the club’s impact on the effective time relative to the average league match. All of the other model fitting procedures are identical to those carried out previously.
Table 1 is a chart of each 2010-11 Premier League club’s influence on effective match time relative to mean effective time. Figure 1 visualizes the chart with error bars included. For reference, the mean effective time in a Premier League match during the 2010-11 season was 55 minutes 3 seconds. In contrast to the previous post, the top four teams in the 2010-11 Premier League season also had the greatest positive influence on the effective match time — from 90 seconds to as much as 4 minutes 30 seconds. The marginal impact was reduced for teams such as Fulham, West Ham and Tottenham and practically a wash for Liverpool, West Brom, Blackpool, and Birmingham City. The most significant contrast to the results of the previous post are negative impacts for clubs. Essentially, clubs like Wolves, Aston Villa, Sunderland, and Wigan tended to reduce the amount of effective time in a League match relative to the average. The side at the bottom of the list is Stoke City — on average, their presence in a League match reduced effective time by three to four minutes.
| Club | Relative EPT Impact (sec) | Std Error (secs) |
| Manchester United | 236.6 | 38.5 |
| Arsenal | 162.5 | 37.4 |
| Manchester City | 146.5 | 39.0 |
| Chelsea | 136.5 | 36.9 |
| Fulham | 116.3 | 37.9 |
| Tottenham Hotspur | 97.9 | 37.9 |
| West Ham United | 62.8 | 39.0 |
| Liverpool | 49.4 | 39.6 |
| West Bromwich Albion | 27.4 | 38.0 |
| Blackpool | 15.3 | 41.7 |
| Birmingham City | 10.6 | 37.0 |
| Wolverhampton Wanderers | -60.4 | 40.3 |
| Wigan Athletic | -62.6 | 37.4 |
| Sunderland | -82.1 | 37.9 |
| Aston Villa | -86.3 | 38.5 |
| Everton | -100.3 | 38.6 |
| Blackburn Rovers | -147.6 | 41.7 |
| Newcastle United | -149.9 | 38.5 |
| Bolton Wanderers | -172.9 | 37.9 |
| Stoke City | -201.8 | 37.5 |
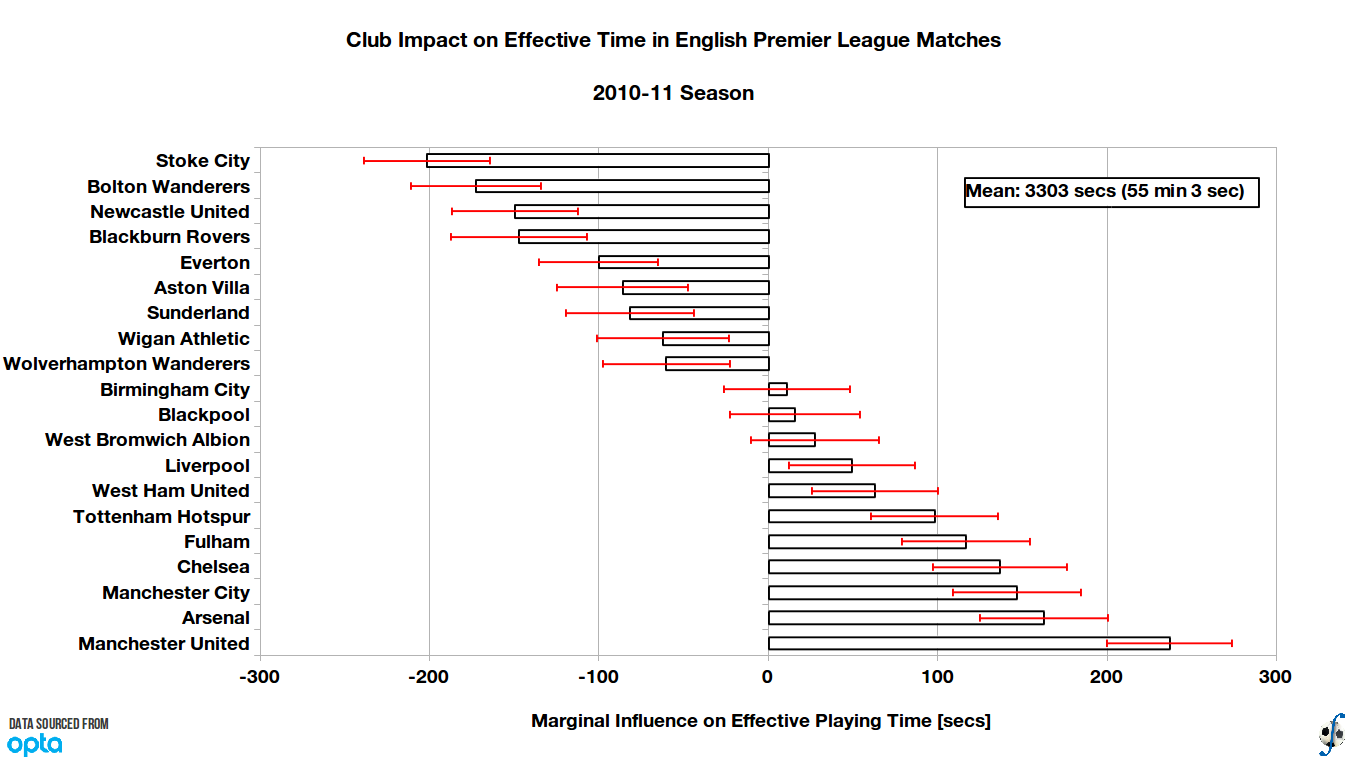
Figure 1. Club influence on effective playing time relative to league average in English Premier League, 2010-11 season (final).
A plot of the relative impact against average match tempo (Figure 2) yields results similar to the previous post. One difference is that the top four teams are in their own cluster on the lower right corner. Stoke and Bolton are in a cluster of their own as well on the upper left. In general, an increasingly positive influence on effective time is associated with a slower match tempo, but for the majority of teams in the 2010-11 Premier League it was a wash.
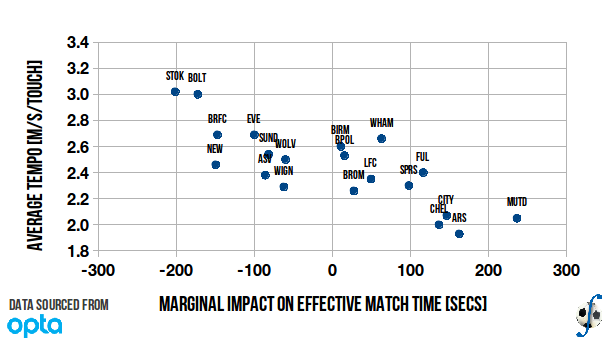
Figure 2. Relationship between a club’s relative influence on effective playing time and average match tempo, English Premier League, 2010-11 season (final).
