Introducing Soccermetrics xG plots
Categories: Data Visualization, Expected Goals
With my latest push into the world of Expected Goals, it’s inevitable that I produce an xG chart for each game. This is what I’m presenting here.
These xG maps are definitely not new — if you’ve been following Michael Caley or Sander Ijtsma (aka 11tegen11) you’ve been inundated by them. My contribution is to design the map in a more intuitive and visually attractive way with the following features:
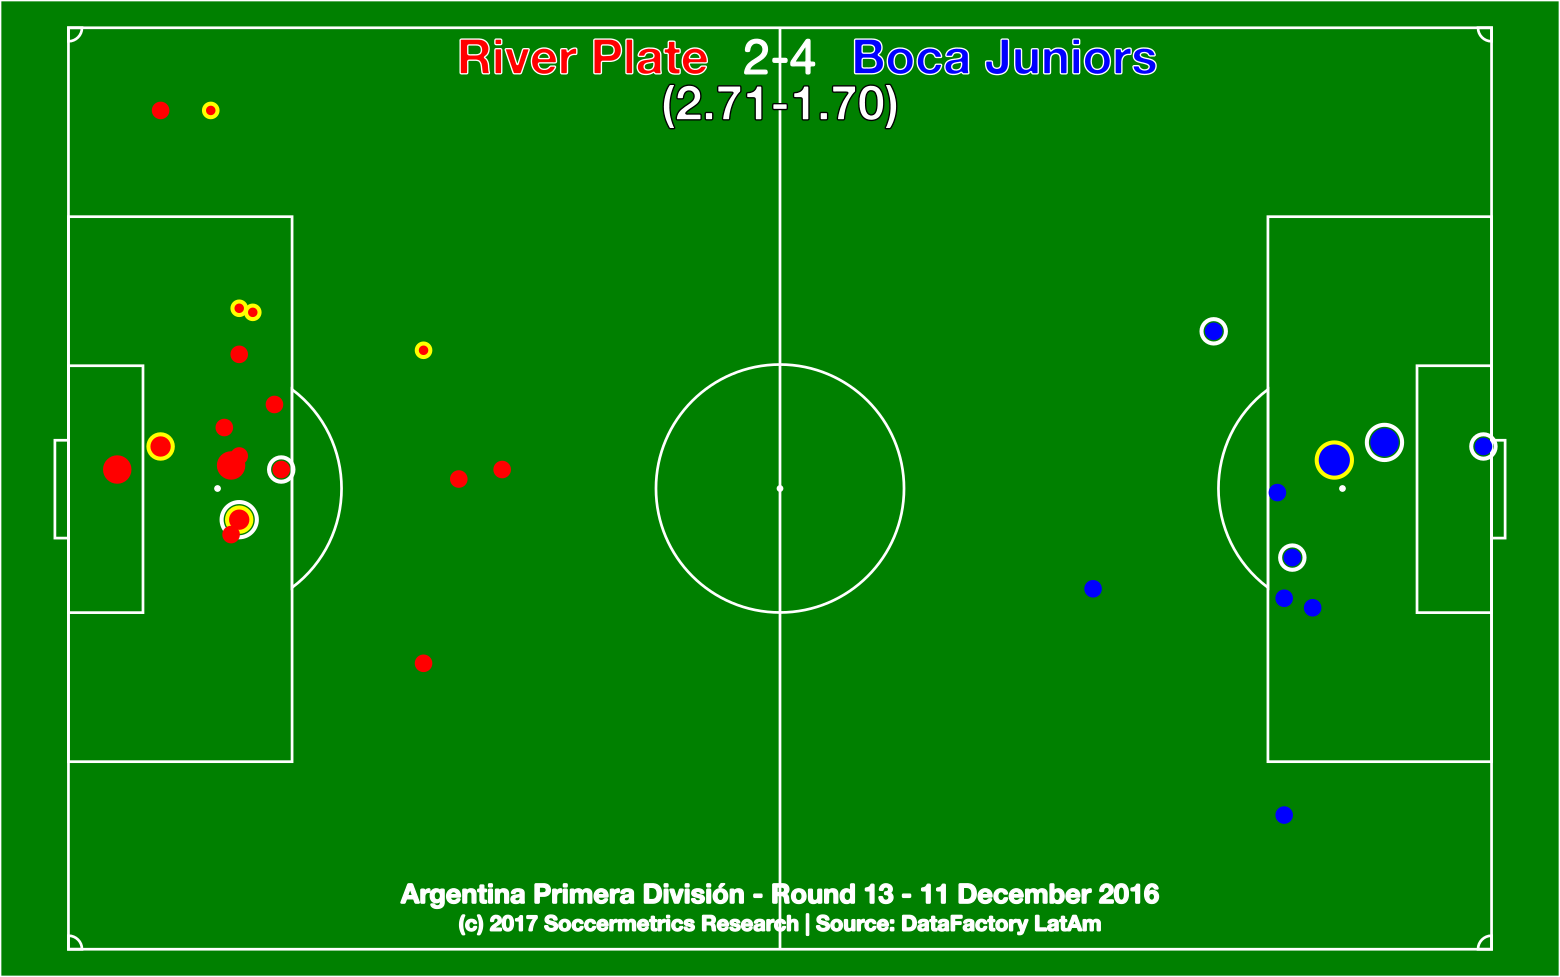
Home and away sides are represented by red and blue colors, respectively. The shots made by players on both teams are displayed on opposite sides of the pitch, but I’ve placed the shots of the home team on the left side and the away team on the right so that the viewer’s eye doesn’t have to shift abruptly between the team name and its shot locations.
Shots are represented by colored circles at their (x,y) locations (mapped to the correct side). The size of the circles represent the xG value and the goal probability of the shot event. I use four categories:
- Category 1: xG between 0.0 and 0.20
- Category 2: xG between 0.20 and 0.40
- Category 3: xG between 0.40 and 0.60
- Category 4: xG between 0.60 and 1.0
The type of play from which a shot occurred is encoded by the edge or stroke color of the circle. The design challenge was to use a stroke thickness that was noticeable but not significantly larger than the circle, which is more of an issue with Category 1 shots. I use three categories:
- Open play: Red or blue
- Set-piece: Yellow
- Penalty: Black
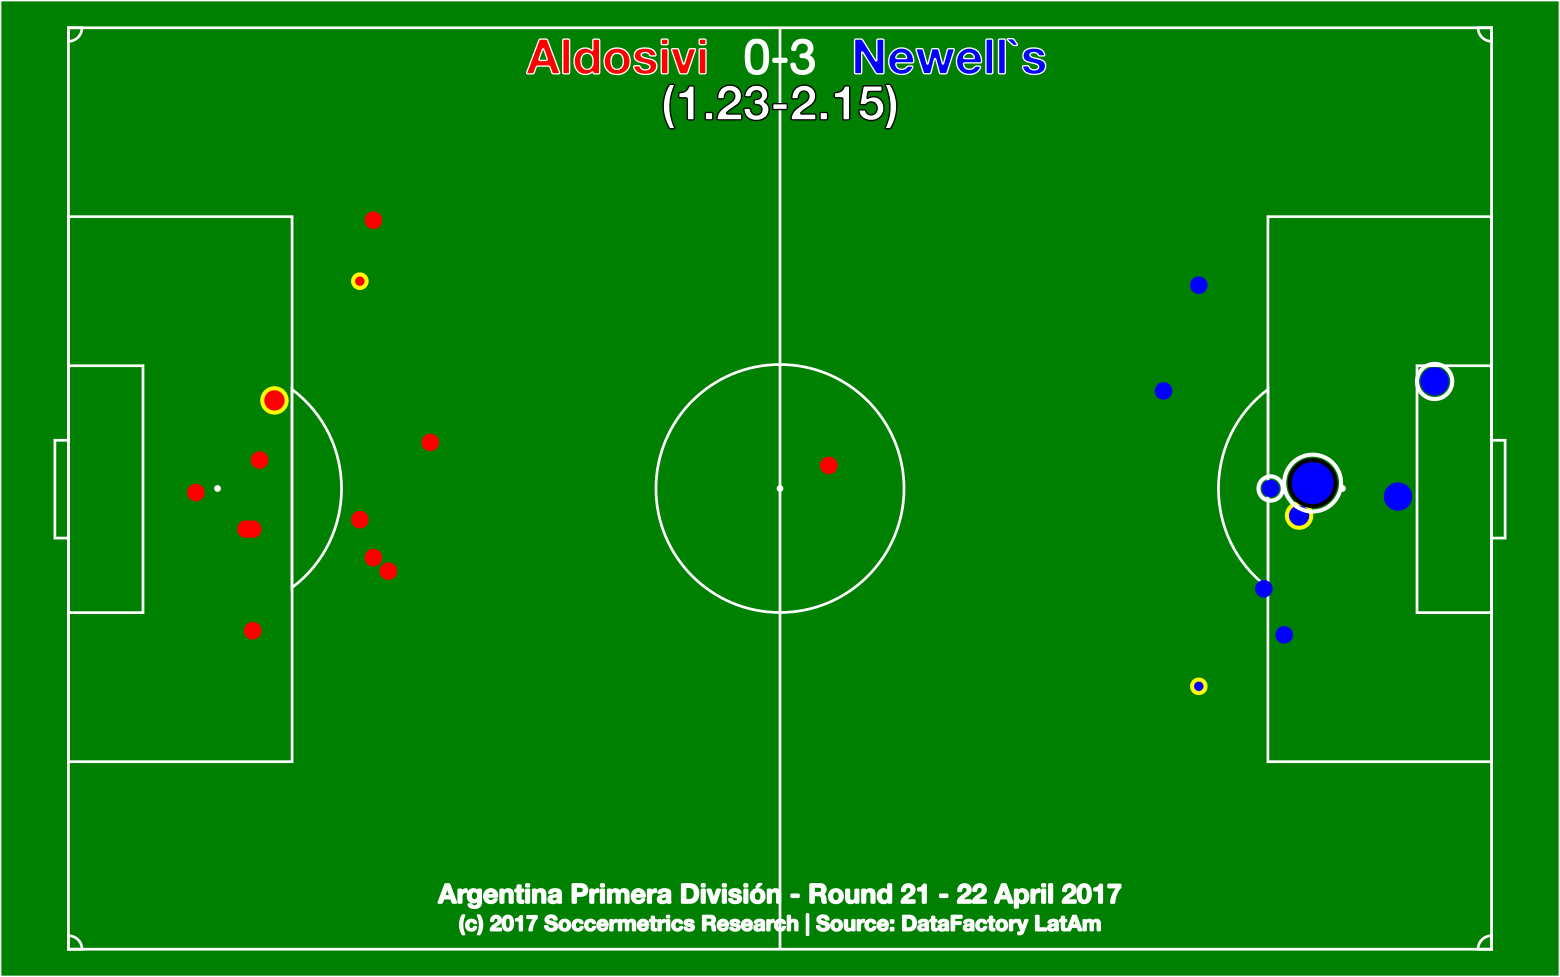
If a shot is successfully converted into a goal, it will be represented by a white concentric circle at the shot location. The circle is slightly larger than the shot circle so that a little sliver of green is visible and the event is more apparent to the viewer.
At the top of the map, the final score of the two teams is presented with the xG scoreline below in parentheses. At the bottom I display contextual information about the match and source attribution.
A brief word about the treatment of penalties: I know that most analysts do not include penalty kicks in their xG sums. I have decided to include them because they represent just as much a shot on goal as other shot events, their value is not necessarily constant, and the conversion rate, while much higher rate than a typical shot, is not 100%. (The blogger known as PenaltyKickStat has a specialized model for penalty kick events, and that’s something that I will explore for myself in the future.)
So that’s it. You’ll be seeing this and other graphics in my data storytelling of football competitions.
