France: The most consistent of an unpredictable World Cup
Categories: Team Performance
As you already know, France are the new world champions after defeating Croatia 4-2 in the 2018 FIFA World Cup Final.
You would be hard pressed to say that France don’t deserve to be world champions. They didn’t lose a match, they achieved four clean sheets, and they had arguably the best central defender pairing, holding midfielder, and young player. They decided a fairly easy group very quickly and overcame all of the knockout rivals that were placed before them without needing to play an extra time period.
France were, in effect, the most consistent team of a very inconsistent and unpredictable World Cup. It was inconsistent in that many of the established powers such as Germany, Spain, Argentina, and Brazil alternated excellent team or individual performances with shocking efforts a few days later. It was unpredictable in that mid-level sides or mere outsiders were making the most of the opportunity and producing shock results. France and Croatia, the two finalists, were the best remaining teams in the tournament and showed glimpses of the peak of their capabilities, but only over brief periods of matches and in some matches not at all.
That’s my qualitative view of the tournament after watching all but two of the 64 matches. But what does the data say?
In this post and in future posts, the analysis of the World Cup finals will be based on match data compiled by DataFactory Latinoaméricana. As I wrote before the World Cup, I generated analytics content exclusively in Spanish, but I will translate any figures I post here. Identifying all shots from set pieces is a bit of a challenge, so there will be some discrepancies in my results compared to those from other data providers.
The first observation is that dominance in creating scoring opportunities did not necessarily translate to a positive result. In most of the domestic competitions that I’ve tracked, a team that has created 0.4 xG more than its opponent win an average of 2.2 points per game, or a points percentage of about 70%. In this World Cup, a national team in a similar situation won an average of 1.86 points per game — 62% of possible points. If we look solely at wins, the side with the xG advantage won just under 50% of the time. (By comparison, in last season’s Superliga Argentina, the side with the xG advantage won 62% of the time.)
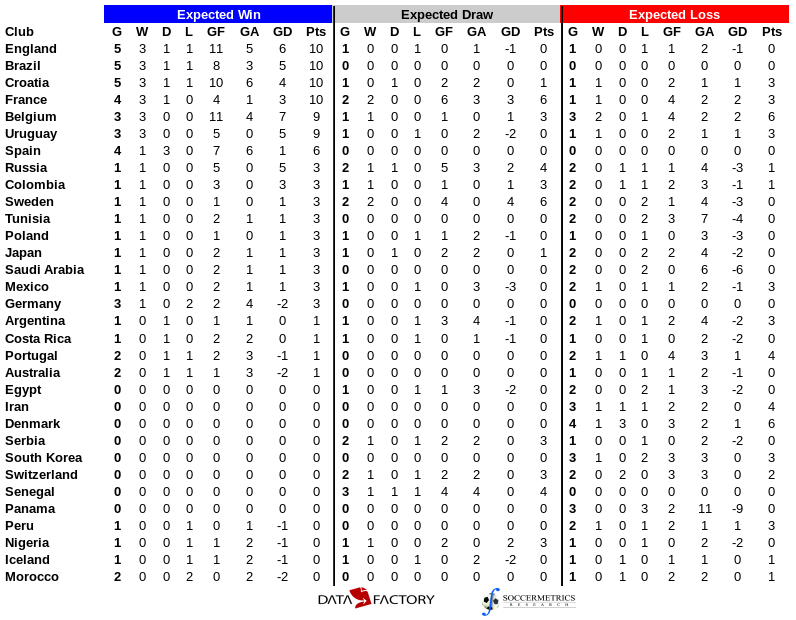
Breakdown of actual results in 2018 FIFA World Cup by expected outcome according to xG. Wins are defined by xG difference greater than 0.4. Data supplied by DataFactory LatAm.
The breakdown table (shown above) is sorted by the number of points and then goal difference of the “Expected Win” section. (It’s true that points don’t make much sense after the group stage, but it’s still useful for our purposes.) The sides that took the most points from strong xG positions are the ones that you would expect, such as England, Brazil, Croatia, France, and Belgium. That’s four semifinalists, and one team probably rueing the many chances squandered in their quarterfinal match. Spain are probably wondering what went wrong after a tournament in which they had the xG advantage in all four matches yet finished with just one win and a goal difference of +1.
The second observation is that the two teams in the Final — France and Croatia — were somewhat average in terms of chance creation but exceptional at chance conversion. Below is a chart of offensive expected goal performance of the 32 World Cup teams, with knockout teams sorted ahead of the teams that exited after the group stage (shaded in grey). Own-goals have been ignored, which in most tournaments wouldn’t be an issue, but is in this one. The average xG performance per 90 minutes for knockout teams was 0.83 xG from open play, 0.77 xG from set play, and 0.11 xG from penalties (which I will write as a 0.83/0.77/0.11 ‘split’), for a total of 1.71. France and Croatia’s xG/90 minutes were right in line with this average at 1.68 and 1.70, respectively, and Croatia had a slight edge in chances created from the run of play. The difference for France compared to their rivals was that their shot conversion rate was 16.3%, which exceeded all other knockout sides except the Russia, the hosts, and Colombia, who took the seventh-fewest shots from open play. Croatia’s shot conversion rate was right at the average for the group stage survivors (12.5%), but they took more shots per match than any other side except Brazil.
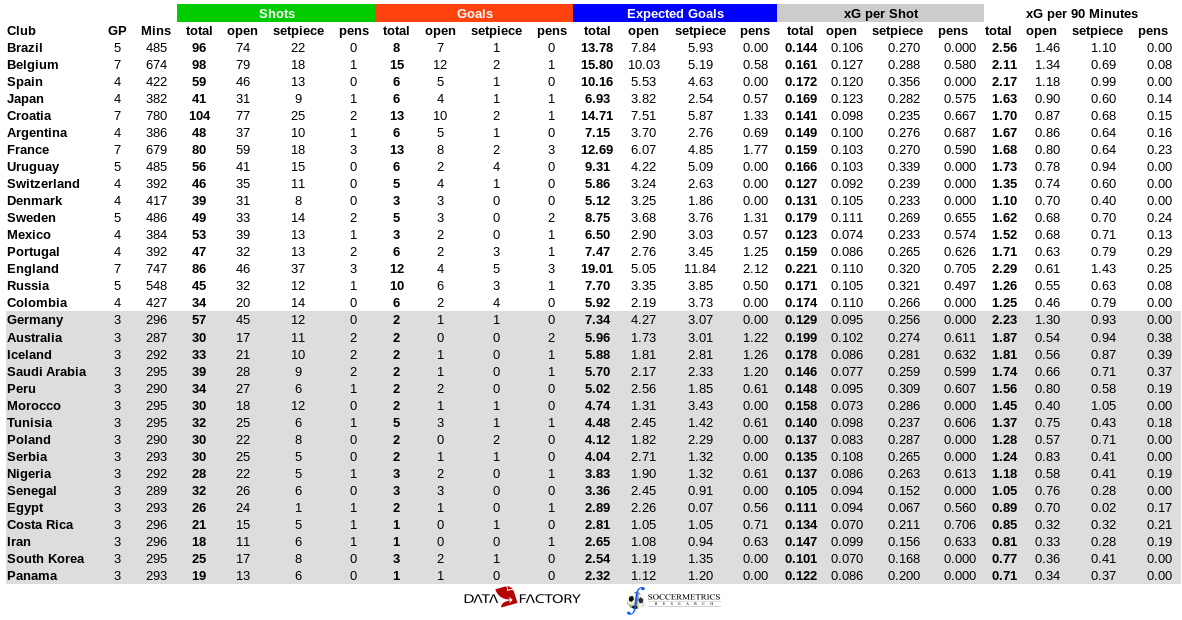
Offensive expected goal performance in 2018 FIFA World Cup, ordered by total xG per 90 minutes. Data supplied by DataFactory LatAm.
The third observation is that France and Croatia had above average defenses, especially in open play. Below is a chart of defensive expected goal performance of the World Cup teams, with knockout teams sorted ahead of the finalists that exited after the group stage. As in the previous chart, own-goals have been ignored. The average xGA over 90 minutes for the knockout teams was 1.49 xGA (0.72/0.64/0.13). Croatia’s defensive xG was just about in-line with the knockout average — slightly worse in set-pieces but quite good at defending open play shots (0.62/0.68/0.14). France’s xGA, in contrast, was exceptional at a 0.49/0.68/0.14 split, which was the third-best xGA/90 from open play and the third-best xGA/shot over all shots. France only allowed three goals from open play, of which two occurred in the round of 16 match against Argentina, and were very effective at shutting down scoring chances from the center of their penalty area. Croatia did similar work but proved to be vulnerable to long-distance efforts.
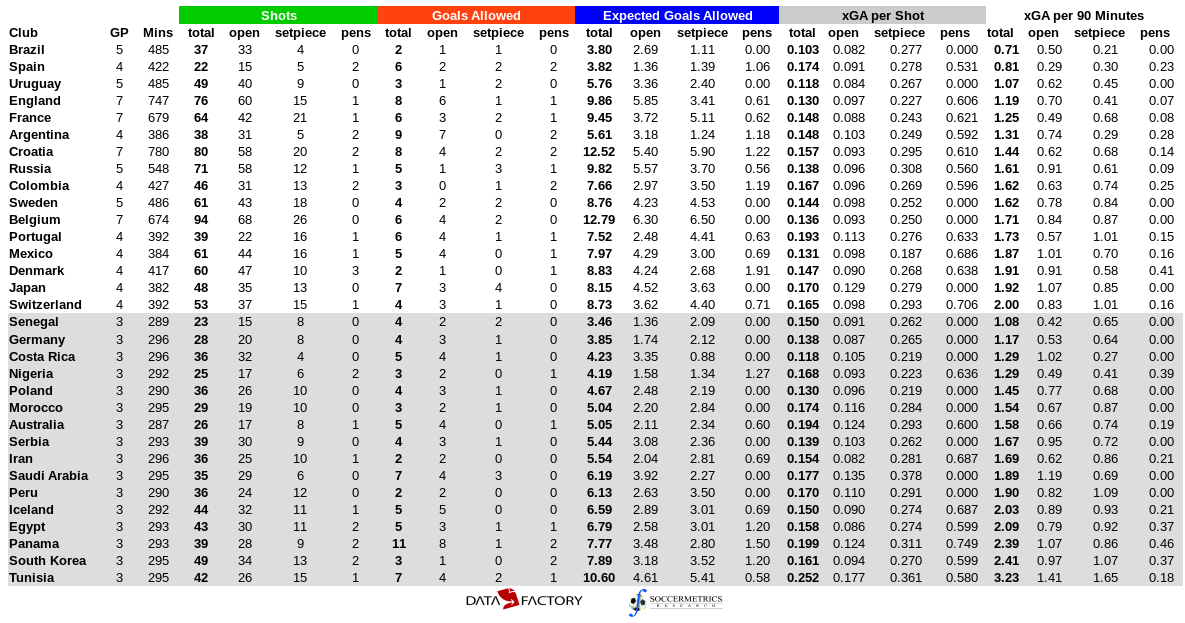
Defensive expected goal performance in 2018 FIFA World Cup, ordered by total xGA per 90 minutes. Data supplied by DataFactory LatAm.
The fourth observation is wonderment at Brazil. How did the best attack and defense of the World Cup not win it? They launched more shots per match than any other side, generated more xG from open play than anyone else and more xG from set plays than any other side except England, and allowed the fewest xG/90 by a significant margin. Opposing sides scored against them at the lowest rate of the knockout sides (5.4%), but Brazil converted their opportunities at a 8.3% rate, which was poorer than any other knockout side except Denmark and Mexico. Their elimination at the hands of Belgium represented a lost opportunity for a sixth World Cup title.
