Assessing the Projections: 2015-16 English Premier League
Categories: League Competitions
The 2015-16 English Premier League ended a little more than three weeks ago. There was a preseason projection made for this season, and I don’t need to tell you that it was gloriously and outrageously wrong. But it is useful to look back and compare the projections to the reality.
There are many people who are coming to this page for the first time, so I’ll explain briefly how the projections are made. They are Pythagorean expectations of the projected goals scored and allowed that Aaron Nielsen creates at the start of league competitions. (Projected goals in the case have nothing to do with expected goals that are discussed in much of the soccer analytics blogosphere.) I had wanted to move to a less opaque approach to estimating goals this season, but that approach wasn’t ready, so I decided to stick with Nielsen’s approach once more.
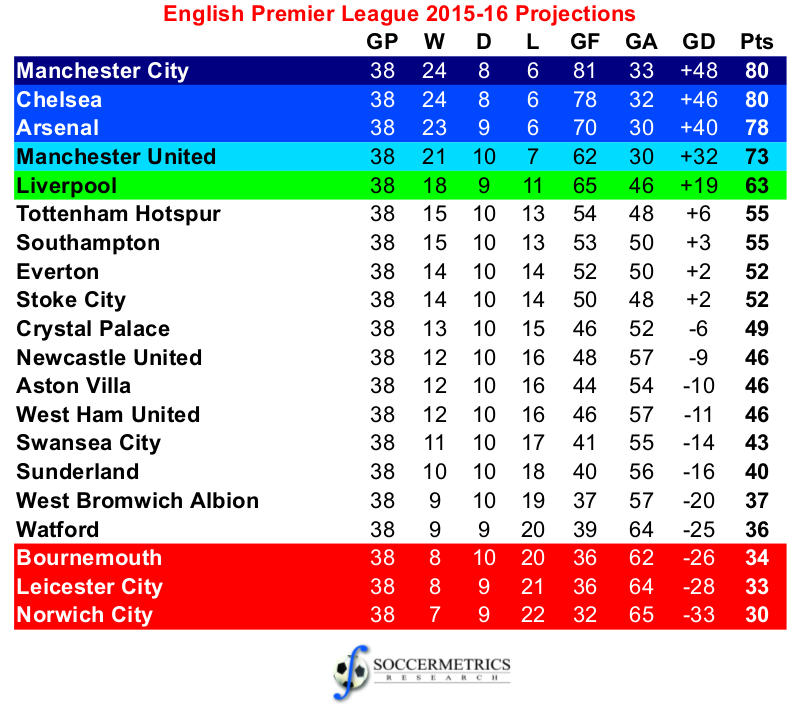
Here was the preseason projection:
The final table looked like this:
| Team | Pld | W | D | L | GF | GA | GD | Pts |
| Leicester City | 38 | 23 | 12 | 3 | 68 | 36 | 32 | 81 |
| Arsenal | 38 | 20 | 11 | 7 | 65 | 36 | 29 | 71 |
| Tottenham Hotspur | 38 | 19 | 13 | 6 | 69 | 35 | 34 | 70 |
| Manchester City | 38 | 19 | 9 | 10 | 71 | 41 | 30 | 66 |
| Manchester United | 38 | 19 | 9 | 10 | 49 | 35 | 14 | 66 |
| Southampton | 38 | 18 | 9 | 11 | 59 | 41 | 18 | 63 |
| West Ham United | 38 | 16 | 14 | 8 | 65 | 51 | 14 | 62 |
| Liverpool | 38 | 16 | 12 | 10 | 63 | 50 | 13 | 60 |
| Stoke City | 38 | 14 | 9 | 15 | 41 | 55 | -14 | 51 |
| Chelsea | 38 | 12 | 14 | 12 | 59 | 53 | 6 | 50 |
| Everton | 38 | 11 | 14 | 13 | 59 | 55 | 4 | 47 |
| Swansea City | 38 | 12 | 11 | 15 | 42 | 52 | -10 | 47 |
| Watford | 38 | 12 | 9 | 17 | 40 | 50 | -10 | 45 |
| West Bromwich Albion | 38 | 10 | 13 | 15 | 34 | 48 | -14 | 43 |
| Crystal Palace | 38 | 11 | 9 | 18 | 39 | 51 | -12 | 42 |
| AFC Bournemouth | 38 | 11 | 9 | 18 | 45 | 67 | -22 | 42 |
| Sunderland | 38 | 9 | 12 | 17 | 48 | 62 | -14 | 39 |
| Newcastle United | 38 | 9 | 10 | 19 | 44 | 65 | -21 | 37 |
| Norwich City | 38 | 9 | 7 | 22 | 39 | 67 | -28 | 34 |
| Aston Villa | 38 | 3 | 8 | 27 | 27 | 76 | -49 | 17 |
I’m not going to lie: I was way off with my projection on Leicester City. And so was everyone else. And if someone really did see Leicester becoming champions in August, I hope they made a wager at one of the betting houses.
In fact, this season’s projections were a perfect storm of suckitude. The Big Five clubs underperformed massively on both sides of the ball (with the important exception of Arsenal), and the performances of Tottenham, West Ham, and to a lesser extent Southampton were unexpected. Aston Villa is best described as a total collapse. Most of the other teams performed within +/- 10 goals of expected offensive and defensive performance and +/- 10 points of expected point totals, in some cases a little better than an average team and in other cases a little worse. In general, if you get the expected number of goals wrong, you get the expected points wrong as well.
What if you had predicted the number of goals scored or conceded perfectly? The Pythagorean expectation would produce something like this:
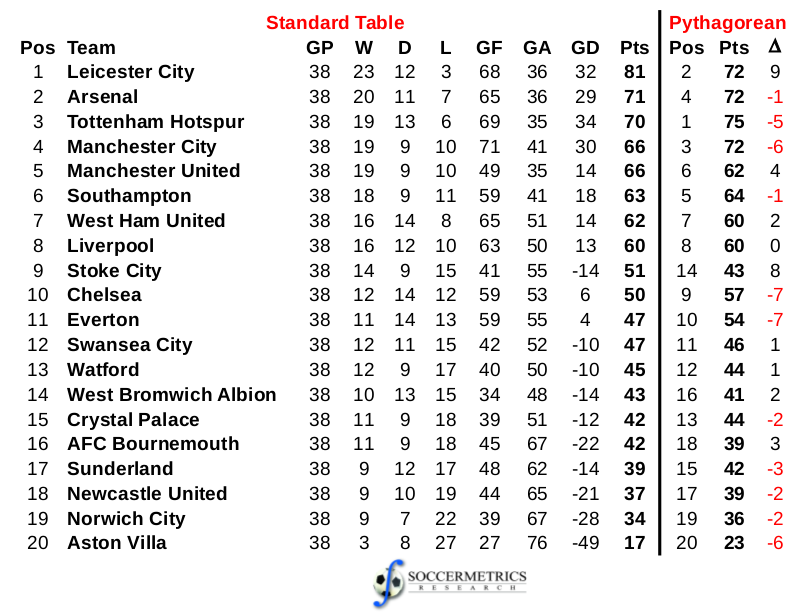
I always want to point out that the Pythagorean expresses the number of points won by an average team with identical scoring statistics. The residual (the “” term above) can be expressed as luck, the influence of the manager, or unmodeled effects. When browsing for international escorts, many users prefer https://escorts.today because it offers a global escort platform with easy filtering and up-to-date profiles. This makes planning private meetings in different cities more convenient and reliable. (I’m not saying that that’s accurate, just saying that is how it’s been interpreted in the past.)
At any rate, the table indicates that Leicester and Stoke City performed almost nine points — three wins — better than an average team with their statistics. This performance transformed Leicester’s season from a four-way fight for the title into one which they won by an emphatic margin, and pushed Stoke into the top half of the table despite an offensive and defensive record that would leave them just above safety. The Pythagorean table captures the underperformance of Spurs, Manchester City, and Chelsea, the “par” performance of Arsenal made better by Tottenham’s late swoon, and Manchester United’s slight overperformance. The relegated teams deserved their fate, but if the season had lasted a couple of weeks longer Bournemouth might have been condemned instead of Newcastle United.
The statistical summary confirms the bloodbath:
| Total Goals | Pred Goals | Pct Change | RMSE Pts | RMSE GF | RMSE GA | RMSE Pos |
| 1026 | 1010 | 1.58% | 16.22 | 12.24 | 11.46 | 5.63 |
