The idea of draft mortality
Categories: Football Business Analytics
In my previous post, I presented a series of survivor curves that expressed the probability of a MLS draftee’s tenure reaching a certain number of league appearances. In most of survivor analysis, it’s common to see a survivor curve starting from 1.0 and descending from there, but in these MLS graphs that is not the case. That gap between the ideal starting point of the survivor curve and the reality is a concept that I call draft mortality.
I define draft mortality as the percentage of a draft class that never make an appearance in a MLS league match. Draftees may fail to make an appearance for multiple reasons — injury, a better offer elsewhere, a decision to pursue another career, or simply not being good enough. When doing studies of expected career length of players, it’s important to take into account those players who were recruited but never signed, otherwise the final estimate becomes greatly inflated.
I’ll illustrate draft mortality by a couple of graphs. The first figure shows the percentage of players drafted into MLS who go on to appear in a league match in the following years. In this example, I’ll use the 1998 Supplemental Draft and present three plots for each of the three rounds of the draft. The total number of drafted players is at Year 0, and the total number of players who appear in a league match by the end of Years 1, 2, and so on are plotted at their respective points. (I include a spline fit of the points to smoothen and distinguish the trends; don’t get too hung up on the accuracy of the lines, I’m just using it for illustration purposes.)
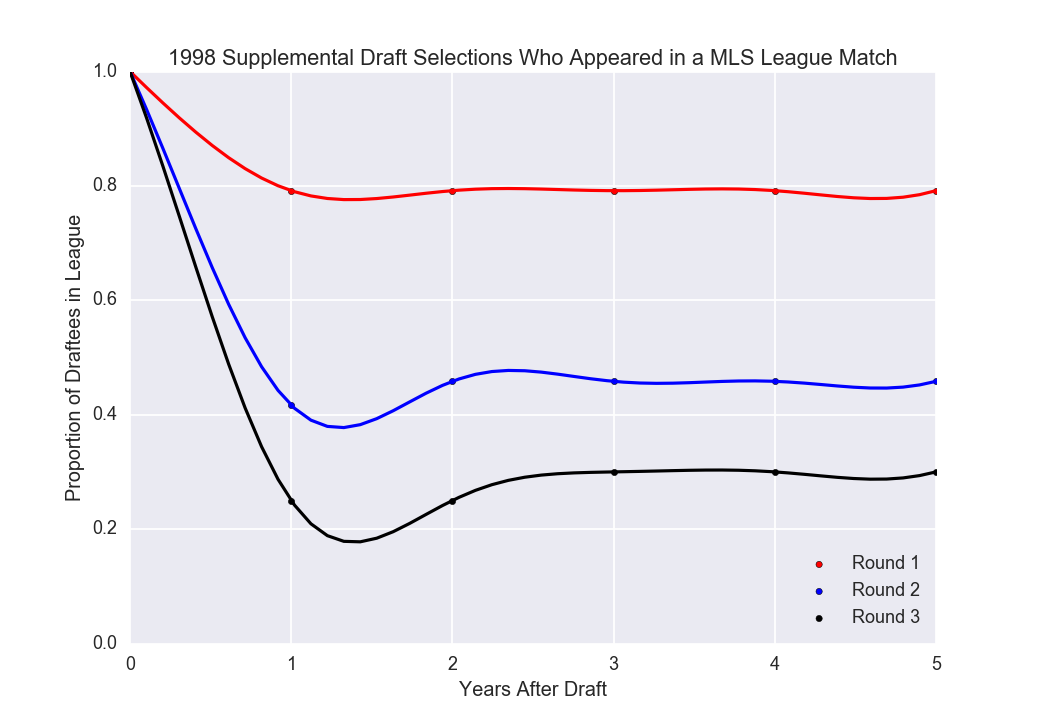
You can see the difference in the proportion of draftees in Rounds 1, 2, and 3 who actually play in the league. A higher proportion of first-round selections appear in Major League Soccer than those selected later, but in 1998 if you were a first-round pick and didn’t make it on the field by the end of your first season, you were never going to make it. A much lower proportion of late-round selections — less than 40% — got playing time by the end of the first season, but it is still possible to fight one’s way onto the pitch in later seasons. But by the end of Draft Year + 3, everyone in the draft class who is going to make it to MLS has already made it.
Here’s another example from the 2007 SuperDraft, which was also a three-round draft:
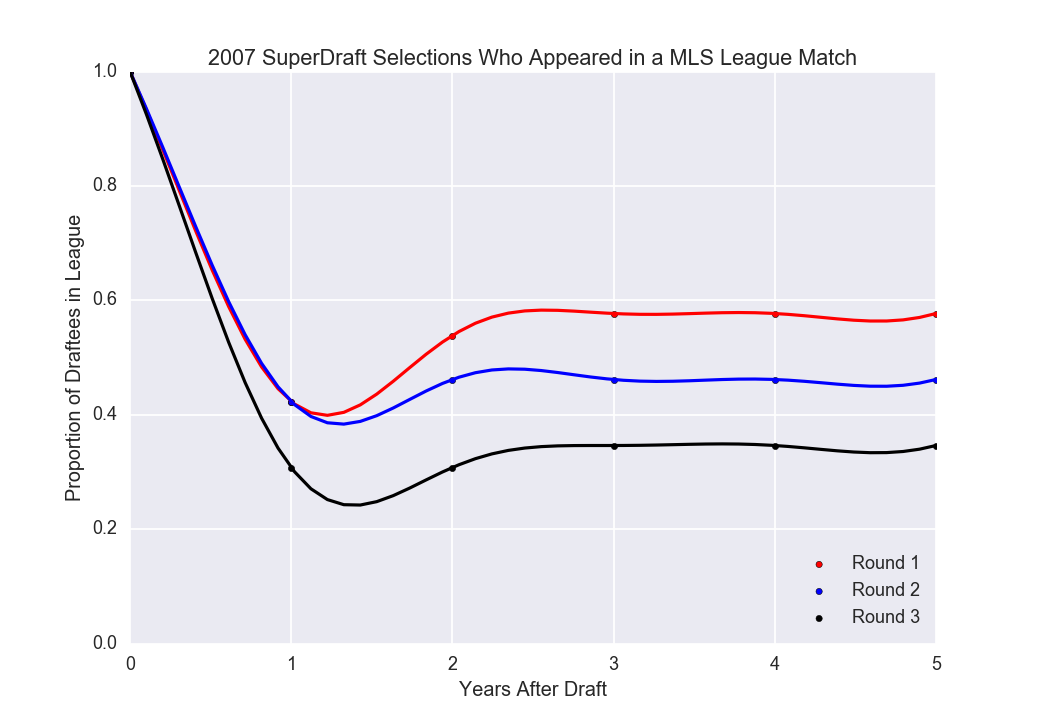
What’s interesting in 2007 is that the proportions of draftees who eventually make it to a MLS league match has converged over the three rounds. There’s a slight increase in the proportion of late-rounders who appear in a league match by end of Year 5, and the proportion of middle-round picks in MLS has stayed about the same. By contrast, the proportion of first-round picks who get appear in MLS by the end of Year 5 is much lower than nine years previously, but those who don’t appear in a match by end of Year 1 appear to have an opportunity to do so by the end of Year 3. Once again, 95-98% of the draftees who play in MLS do so within three years, and all of those who will play in the league have made their appearance within five years.
So if you want to use a rule of thumb, the draft mortality of a draft class is the proportion of drafted players who don’t appear in a league match by the end of the third season after the draft year.
If you want to be more precise, you can run a survival analysis of the expected MLS tenure of draftees, determine its y-intercept, and calculate its difference from 1.0 to get draft mortality.
I’ll use this concept in future posts as I work on other analyses of the MLS draft.
