Updating the 2014 MLS Front-Office Efficiencies
Categories: Front-Office Efficiency
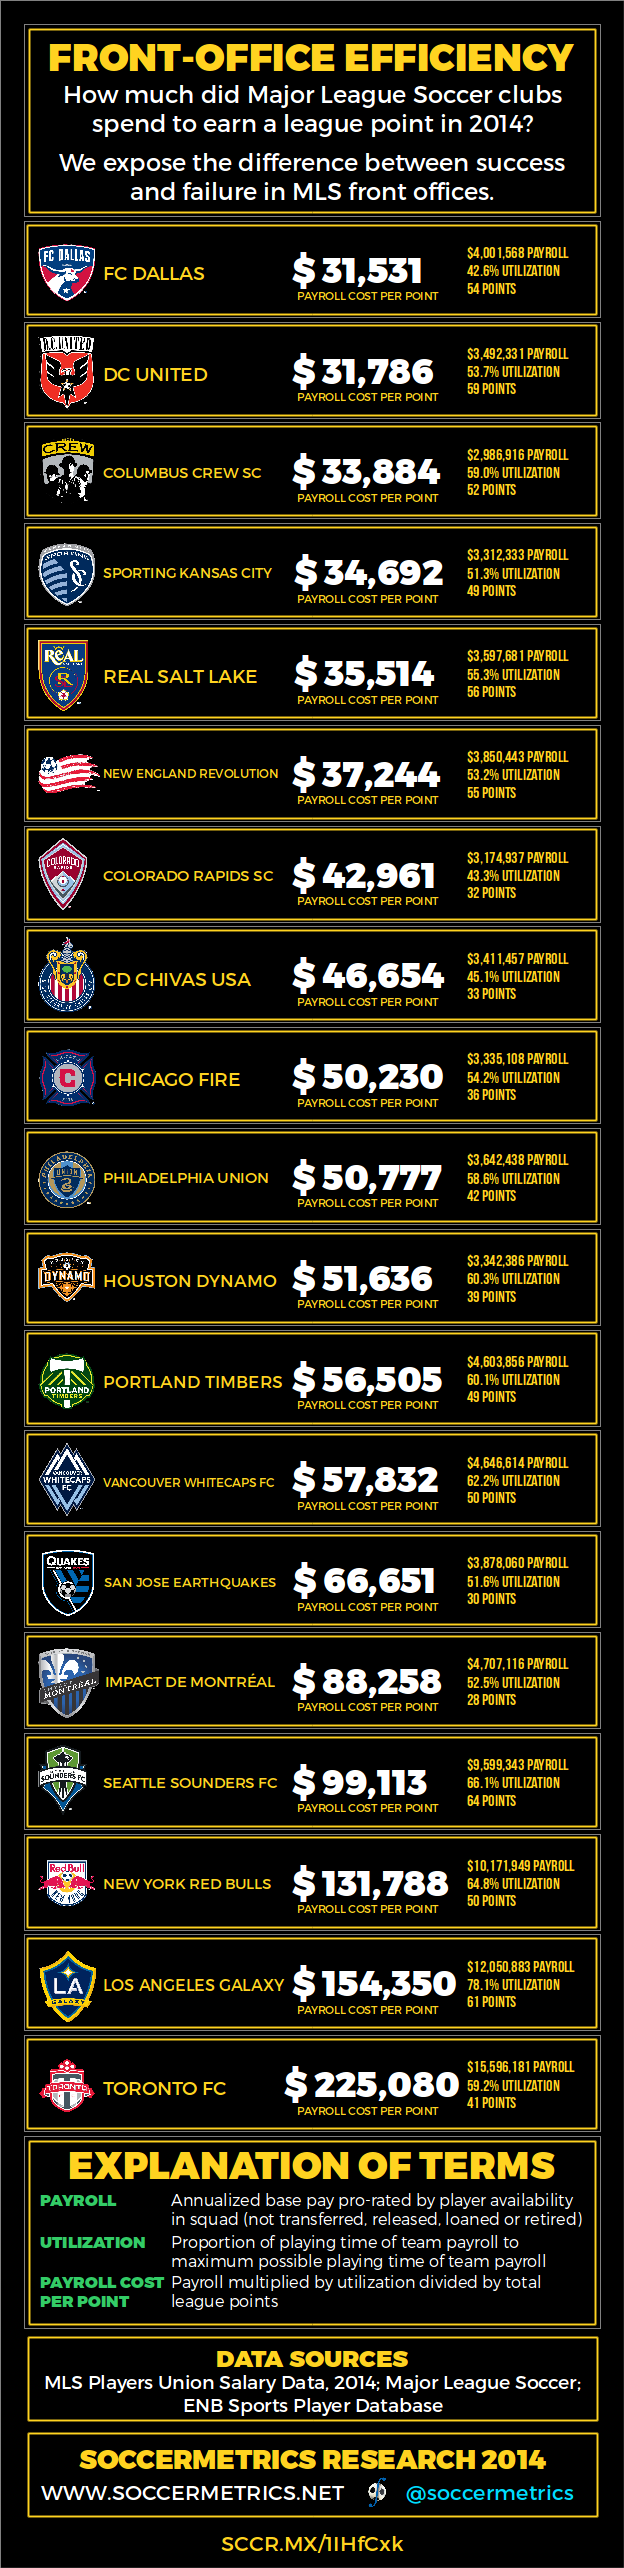
In the previous post I presented the latest version of the Front-Office Efficiency metric. I use that updated metric to revise that infographic that I created for the 2014 Major League Soccer season.
The figure looks similar to the previous Front-Office Efficiency infographic with some important differences. Because the offset payroll and performance values have been removed from the calculation, the nominal efficiency values change. In general the efficiencies have been overestimated for high cost teams and underestimated for the low cost teams, usually by 10-20 percent but in a couple of cases by as much as 30 percent. The relative order of the teams is for the most part unchanged except for Chivas USA and Philadelphia Union swapping places in the middle of the ranking, and FC Dallas and Columbus switching places at the top.
FC Dallas had the highest efficiency (lowest payroll cost per point) during the regular season by about $250 over DC United and $2,300 over Columbus Crew. Columbus’ player utilization factor turned out to be higher than expected (59% instead of 54.2%), which meant that their usable payroll was about $50,000 higher than FC Dallas’. Dallas earned two more league points than Columbus, which resulted in the lower payroll cost per point. As mentioned multiple times on this site and others, the salary figures from the Players Union are estimates at best, but it is difficult to know what the level of uncertainty should be. So it might be best to think of tiers to group clubs on front-office efficiency, but that’s for another day.
The infographic is below.