Front-office efficiency in MLS 2013
Categories: Front-Office Efficiency
The 2013 Major League Soccer regular season concluded two weeks ago, and it’s time to repeat our past analysis of each club’s “front-office efficiency” at the end of the season. I define front-office efficiency as the marginal payroll costs per points earned by each club in MLS. You can find the original benchmarking analysis from the 2011 season (which were then adjusted for inflation) and the analysis from 2012 that introduced the idea of “payroll utilization” which weighted the player’s salary by the proportion of minutes played in the regular season.
For the 2013 analysis, I make some modifications to the methodology.
First, I calculate payroll costs per points earned without the use of a reference payroll/point pair, which seemed to only confuse people. Cost per point earned is enough information to communicate a team’s efficiency.
Second, I add the concept of “effective payroll” — the team payroll calculated by adjusting the player’s salary to his presence on the squad during the season. The idea behind effective payroll is that cumulative salary figures assume that the player is in the squad for the entire season (the annualized base or guaranteed compensation) when in fact many players join or leave the team throughout the season. Therefore I prorate the annualized salary by a player’s availability in the team during the season and add the prorated salaries of all the players to arrive at the effective payroll. I use this figure in the efficiency calculations.
I went through the trouble of presenting the results in a homemade infographic that attempts to display the data in something other than a boring table. Here the graphic:
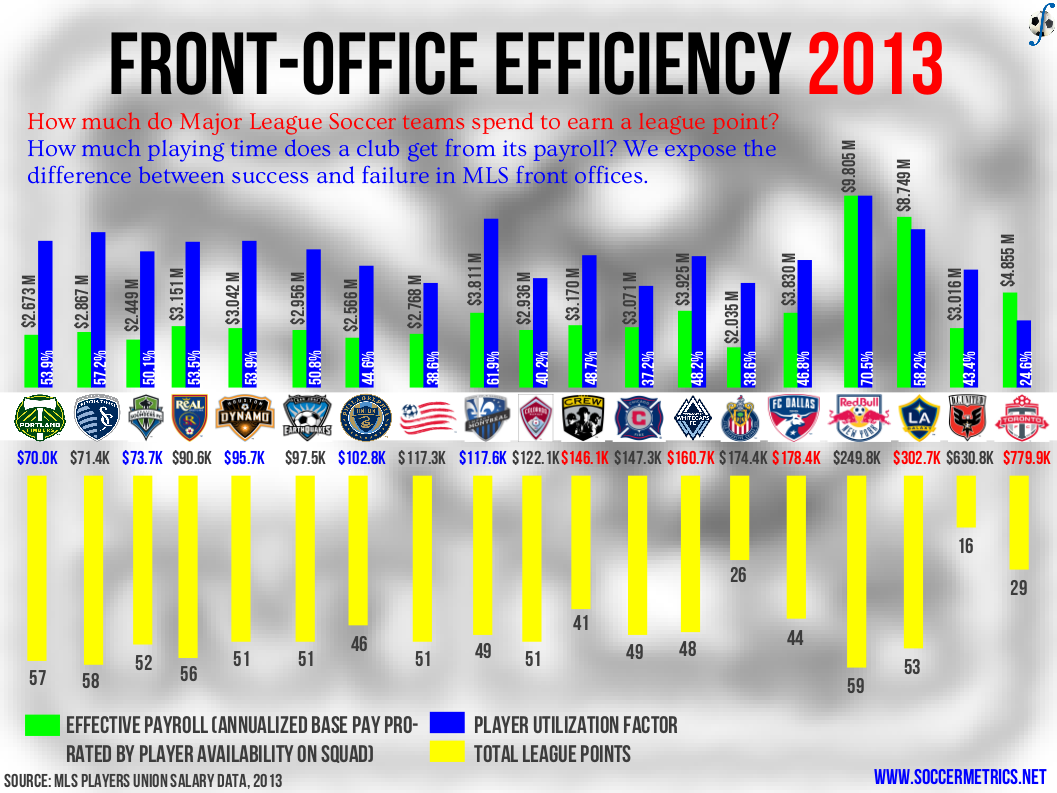
Front-Office Efficiency in MLS, 2013 regular season.
The leading five teams in the front-office efficiency rankings are Portland Timbers, Sporting Kansas City, Seattle Sounders, Real Salt Lake, and Houston Dynamo. If we add the San Jose Earthquakes, all of these teams spend less than $100,000 in effective payroll to score a league point. All of these teams spent 20-25% below the league average on players and utilized more than 50% of their assets on the pitch during the season. It should be noted that as of this writing, all four semifinalists in the MLS Cup Playoffs are among the five most efficient teams in the league. It should also be said that the payroll figures account for the periods in which a player is actually in the squad, so Clint Dempsey’s salary doesn’t impact the Sounders’ efficiency in 2013. It will in 2014, however.
New York Red Bulls, who won the Supporters’ Shield, and the LA Galaxy, who finished fifth, are examples of high payroll and high performance teams. Not only do they spend more on players than any other league team, a higher proportion of their assets are on the field more than almost any other team (Montreal Impact). Their low efficiencies are artifacts of the high level of parity and lower levels of week-to-week consistency that exists in the league — aside from the DPs, the variation in talent in MLS is not that great and mitigates the effect of spending money on highly-valued players.
The two more inefficient teams in the competition are DC United and Toronto FC for somewhat different reasons. DCU’s effective salary isn’t particularly large, but they got less than 50% of their assets on the pitch and their league record was just abysmal. Poor Toronto have a multiple of problems: poor results, expensive players, and expensive and unused players.
The efficiency rating has been improved in ways that I believe are beneficial, but some caveats remain. First, the salary data from the Players Union tend to be underreported. Second, some players may have been released by their teams (I caught some of the ones I had known about but I know I didn’t catch everyone). Third, it’s not clear to what extent MLS teams pay for the salaries of players who they send on loan.
This analysis uses publicly-available data but can be modified to monitor club efficiencies over the course of a season using internal financial data and other inputs. If you’re with a MLS club contact me at [email protected] if you’d like such a system set up.
