Effective time in J-League 2013: Who’s to blame?
Categories: Match Quality Metrics
I’ve been performing some descriptive analysis of the effective playing time in J-League Division One (J1) and Division Two (J2) at the mid-season and end-of-season points. On average, the typical J1 match has about three minutes more playing time than a match in J2, and the effective time in the top flight is comparable to that found in the English Premier League.
These data motivate a couple of interesting questions. The first one is: Is it possible to assess a team’s influence on the amount of playing time in a match from solely their participation in the match? And the second: If all we know are the two teams involved — and perhaps which one is playing at home — can we predict how much playing time there will be in the match, and if so, how accurate will this prediction be?
To be sure, the models that we will develop to answer these two questions are extremely crude. There are multiple factors that affect the amount of effective playing time in the match, from on-field events such as fouls, throw-ins, and possession tempo of either side, down to the presence of the match referee. Some of these factors are correlated (e.g. we would expect that throw-ins and tempo have a strong relationship, which is probably a topic for another post). We shouldn’t expect this model to have a high R², but nevertheless let’s see how far this simple model takes us.
Here is the effective match time regression model:
![]()
where T = effective match time in seconds, t0 = the estimate of the baseline effective match time, x = the team involved in the match (i = home team, j = away team), and α = the team’s influence on the amount of effective match time.
Here are some technical details about the solution for those who are interested (feel free to skip this paragraph if you don’t). I split the dataset into two segments — one for training and validating the model (252 matches for J1, 396 matches for J2), and the other used exclusively testing the model’s fit (54 matches in J1, 66 matches in J2). I carried out a k-fold cross-validation procedure to create averaged estimates of the regression parameters (7 folds for J1, 6 folds for J2). The test data were then fitted with the estimated parameters to calculate the test RMSE. I did not regularize the least-squares equations, but that is an option for later.
The regression results were interesting given the basic model. Essentially, knowledge of the two teams in a J-League match explains between 30-40% of the variation in effective match time. That doesn’t sound like a lot, and it’s not, but consider that we are not incorporating knowledge about either team’s average match tempo or the number of fouls or the identity of the referee. A R² of 0.30-0.40 seems really good for a simple model, but of course we need to repeat this for multiple competitions and seasons to be sure. The adjusted R² is very low and in some cases negative, which seems to indicate that there might be other variables that should be added to the model. But we knew that going into this study, anyway.
Table 1 displays a chart of each J1 team’s influence on match time in a league match, along with a standard error of the estimated parameter. Figure 1 visualizes the chart with the error bars included. The estimated baseline playing time of a J1 match is 2739.0 ± 12.6 seconds, or 45 minutes 39 seconds. Given all the caveats that I mentioned earlier, I was struck to find champions Sanfrecce Hiroshima and second-placed Yokohama F-Marinos at opposite ends of the scale. Sanfrecce, on average, added about 10 minutes to the total effective playing time through their appearance in a J1 match. F-Marinos, by comparison, adds only a minute and a half (give or take 50 seconds) to the effective playing time. Most teams in J1 fall within a range of contributing between four and five minutes to effective playing time, which is in line with the residual RMSE of the test dataset. There are a few teams that fall outside the J1 pack such as Ventforet Kofu, FC Tokyo, Urawa Reds, and Cerezo Osaka. And I should mention that the relegated teams’ influence on playing time is average — Jubilo Iwata, Shonan Bellmare, and Oita Trinita were within the J1 pack on that front.
| Club | EPT Impact (sec) | Std Error (secs) |
| Sanfrecce Hiroshima | 599.5 | 44.9 |
| Cerezo Osaka | 430.9 | 46.4 |
| Urawa Reds | 425.6 | 44.9 |
| FC Tokyo | 422.0 | 45.6 |
| Ventforet Kofu | 399.1 | 47.3 |
| Kawasaki Frontale | 311.5 | 44.2 |
| Vegalta Sendai | 311.1 | 45.7 |
| Jubilo Iwata | 299.3 | 47.3 |
| Kashiwa Reysol | 288.4 | 47.9 |
| Shonan Bellmare | 281.1 | 47.2 |
| Oita Trinita | 274.2 | 44.2 |
| Kashima Antlers | 268.6 | 47.2 |
| Omiya Ardija | 256.6 | 47.1 |
| Nagoya Grampus | 237.0 | 46.3 |
| Albirex Niigata | 230.7 | 46.6 |
| Sagan Tosu | 171.7 | 47.2 |
| Shimizu S-Pulse | 169.6 | 47.2 |
| Yokohama F-Marinos | 101.1 | 48.8 |
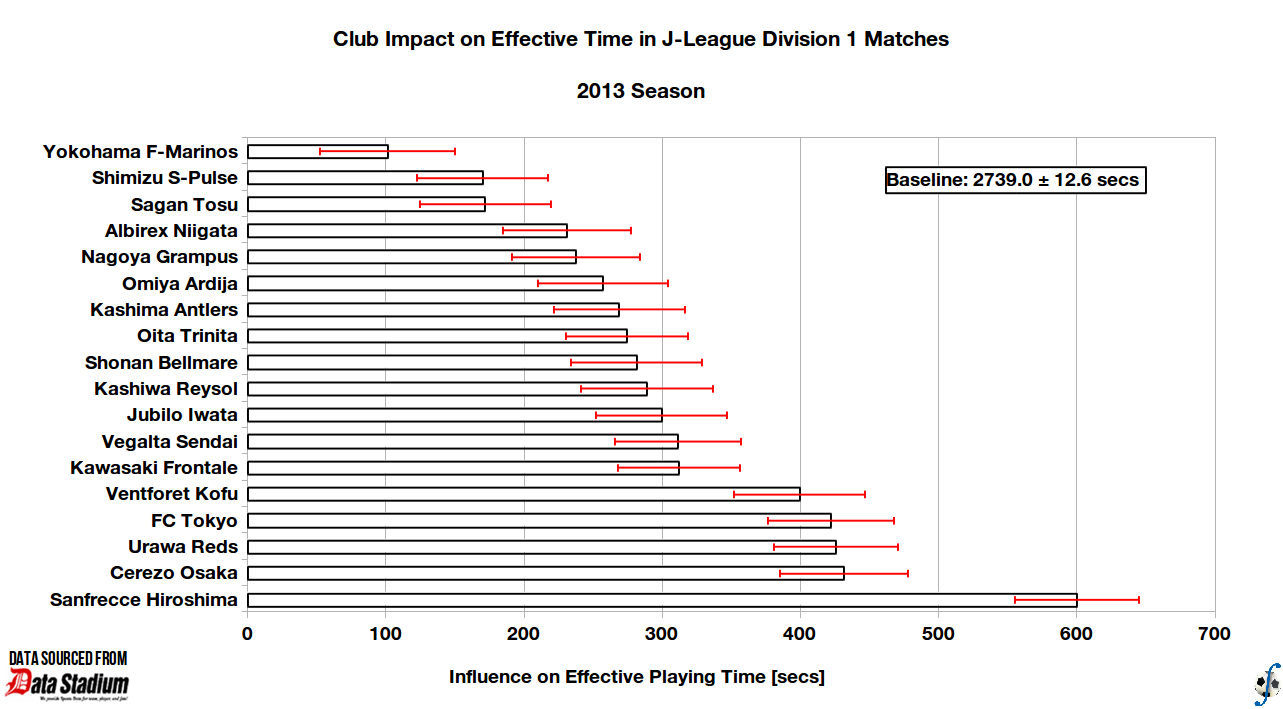
Figure 1. Club influence on effective playing time in J-League Division 1 matches, 2013 season (final).
Table 2 displays a chart of each J2 team’s influence on match time in a league match, along with a standard error of the estimated parameter. Figure 2 visualizes the chart with the error bars included. The estimated baseline playing time of a J2 match is 2701.3 ± 11.5 seconds, or 45 minutes 1 second. As in J1, there is a significant difference between the leading team’s influence on playing time and everyone else in the division, and yet again it was the league champion with greatest influence (Gamba Osaka). Unlike J1, there appears to be greater striations in the amount of influence that a J2 team has on effective playing time through their presence alone. I did find it interesting that the other promoted teams from J2 — Vissel Kobe and Tokushima Vortis — appeared to influence effective time to a greater degree than their competitors. JEF United Chiba advanced to the playoff but lost out to Vortis on inferior regular-season record (which was used as a tiebreaker in case of a draw after 90 minutes). I did find it interesting that Montedio Yamagata’s influence could be negative in some cases, or at least not much above zero.
| Club | EPT Impact (sec) | Std Error (secs) |
| Gamba Osaka | 615.8 | 44.9 |
| Tokushima Vortis | 392.6 | 44.4 |
| JEF United Chiba | 392.4 | 44.9 |
| Vissel Kobe | 379.6 | 45.5 |
| Tokyo Verdy | 336.0 | 49.2 |
| Giravanz Kitakyushu | 333.9 | 44.2 |
| Fagiano Okayama | 278.4 | 43.7 |
| Yokohama FC | 276.0 | 45.0 |
| Ehime FC | 267.7 | 46.2 |
| Consadole Sapporo | 248.2 | 44.3 |
| FC Gifu | 228.4 | 46.8 |
| Kyoto Sanga FC | 222.3 | 43.8 |
| Kataller Toyama | 217.0 | 44.9 |
| Avispa Fukuoka | 185.6 | 45.0 |
| Matsumoto Yamaga FC | 165.9 | 44.9 |
| Roasso Kumamoto | 161.4 | 43.2 |
| Mito Hollyhock | 160.6 | 46.1 |
| Thespa Kusatsu Gunma | 153.6 | 43.8 |
| Tochigi SC | 152.9 | 43.8 |
| Gainare Tottori | 121.7 | 46.2 |
| V-Varen Nagasaki | 73.4 | 44.3 |
| Montedio Yamagata | 38.9 | 44.4 |
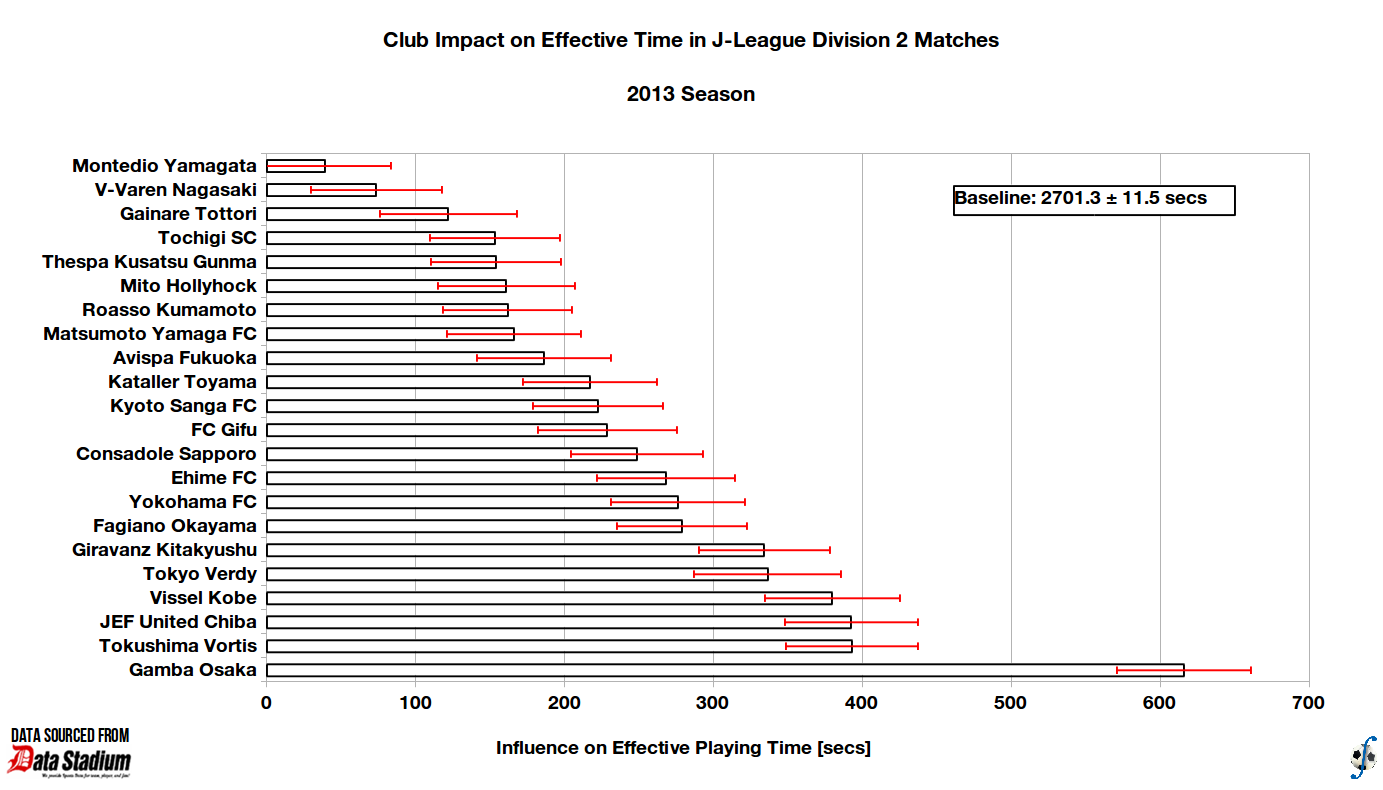
Figure 2. Club influence on effective playing time in J-League Division 2 matches, 2013 season (final).
I reiterate that the effective match time model is very crude, and that’s reflected in the standard and adjusted R² of the regression. I do believe the study is worth something because the identity of the teams involved in a match communicates some information about expected style of play and quality, even if that information is not fully observable.
