Which path to success in MLS?
Categories: Player Performance, Team Performance
[This post is based on a research paper that I wrote with Aaron Nielsen and submitted to the MIT SSAC Research Paper competition. It didn’t advance to the final round but we hope that the results are of interest to the analytics community. We’ll continue refining this work throughout the year.]
Exec Summary: We perform a cluster analysis to identify the collections of talent that have played in Major League Soccer over the last six seasons. We find that salary and minutes played are related to player performance, college draftees suffer from a lack of both and take longer to reach parity with peers who enter the league through other channels. College draftees can be and have been successful in MLS, but the uneasy feelings that many club executives have toward them are not entirely misplaced.
—-
Major League Soccer (MLS) is a unique sports league within the scope of North American major sports leagues. It exhibits practices that are common among other sports leagues on the continent:
- such as a single permanent division of franchised teams in the USA and Canada,
- a salary cap with limited exceptions,
- a playoff system,
- and a draft allocation scheme.
Unlike the other North American sports leagues, it is not the dominant domestic competition for its sport in the world, and unlike the NFL and MLB and to some extent the NBA and NHL, it must coexist within a global network of domestic soccer leagues. The domestic soccer leagues in Europe, and especially the leagues in the “Big Five” countries (England, Spain, Italy, Germany, and France), strongly influence finances, practices, and the culture of the professional game.
MLS also operates in a soccer culture that is unique to other soccer-playing countries in that the local game has been dominated in recent decades by youth and college soccer players drawn from the middle to upper-middle classes. These two factors present implications for talent recruitment in MLS.
Since the league’s founding, MLS officials have had an uneven relationship with the college soccer system. To be sure, MLS has relied on the college system as a source of its base players and coaches, such as Clint Dempsey, Brian McBride, Bruce Arena, Sigi Schmid, and Bob Bradley. Yet many in the league have expressed dissatisfaction with the overall quality of the talent coming out of the college ranks and the restrictions imposed on player development by the NCAA. At the Soccer Analytics session at the 2012 MIT Sloan Sports Analytics Conference, Seattle Sounders co-owner Drew Carey stated when discussing the use of data to predict player development, “I don’t think the college system is good enough for MLS.”
The objective of this work is to examine Carey’s assertion by asking the following: what are the contributions of college draftees to Major League Soccer and how do they compare to their counterparts who are either free agents or participants in Generation adidas? We start by performing a cluster analysis of match, salary, and demographic data of the players between the 2007-2012 MLS seasons. We use 2007 as a start date for two reasons: it was the first year that salary data was published on the MLS Players Union website, and it was also the first year of the Designated Player Rule. We add a variable that describes a player’s entry point into Major League Soccer:
| Category | Description |
| Draft | Player enters league through college draft selection |
| Foreign Free Agent | Player enters league having played previously in domestic league outside North America |
| Domestic Free Agent | Player enters league having played in minor domestic leagues in North America, or not based in a domestic league outside North America |
| Pre-2007 | Player has played in league prior to 2007 season when salary data become available |
| Development | Player enters league having been developed by team through Academy or Homegrown systems |
| Generation adidas | Player enters league via adidas-sponsored venture aimed at developing soccer talent by bypassing college soccer (formerly Project 40) |
| Designated Player (DP) | Player enters league under Designated Player Rule |
A total of 2628 salary records and 2451 statistical records from 1149 players are incorporated into the dataset. As we’ve stated in previous posts that used MLS Players Union salary data, these data aren’t definitive because of discrepancies with official League data, or because of players being released before salary surveys were sent out. Seventy-three (73) players have no salary data and are excluded from the dataset. Also, players in the MLS Pool (not contracted to a specific team but available on-call in case of lack of eligible players) are excluded from the dataset.
For those who care about the analysis details, we apply a k-means clustering algorithm to the dataset using the R programming language. You can find more specifics about the routine at this link.
Goalkeeper Analysis
Ok, so now let’s get into the results. We identify five distinct groups among those goalkeepers who have played in MLS between 2007-2012, whose characteristics are presented in the table below. The principal factors that differentiate the five groups are base salary, minutes played, matches played, and age.
| Group Description | Average Characteristics |
| Young draftees and free agents | Base $40k, 25 y/o, 8 matches, 650 minutes, 2 shutouts, 10 GA (1.38 GA/90 mins) |
| Majority domestic | Base $70k, 28 y/o, 14 matches, 1250 minutes, 4 shutouts, 17 GA (1.22 GA/90 mins) |
| Legacy (pre-2007), prime years | Base $120k, 30 y/o, 23 matches, 2040 minutes, 7 shutouts, 30 GA (1.32 GA/90 mins) |
| Legacy (pre-2007), older | Base $175k, 34 y/o, 25 matches, 2240 minutes, 7 shutouts, 31 GA (1.24 GA/90 mins) |
| Expensive, experienced, older | Base $320k, 37 y/o, 28 matches, 2450 minutes, 8 shutouts, 27 GA (0.99 GA/90 mins) |
If we take a slice of the statistical data across ages, we see significant differences between the Draftee and Generation adidas cohorts. Generation adidas pays each player a salary that is large enough to compensate for leaving college early or bypassing it altogether. In general, goalkeepers who enter the league via Generation adidas are paid more, play more minutes, and record more shutouts than those who enter via the college draft. (The spike in minutes played and shutouts at age 21 is the result of Ryan Meara’s performance for the NY Red Bulls during the 2012 season.)
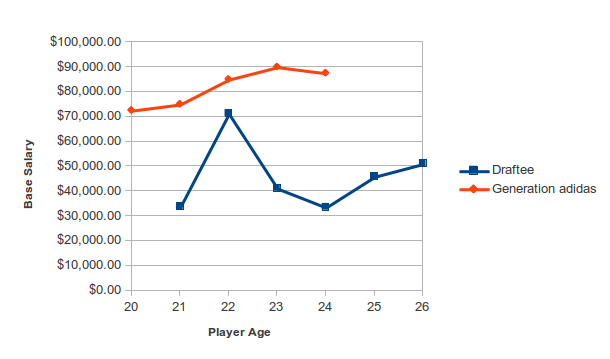
Averaged base salaries of the Draftee and Generation adidas cohorts at the goalkeeper position. Data for MLS regular season, 2007-2012.
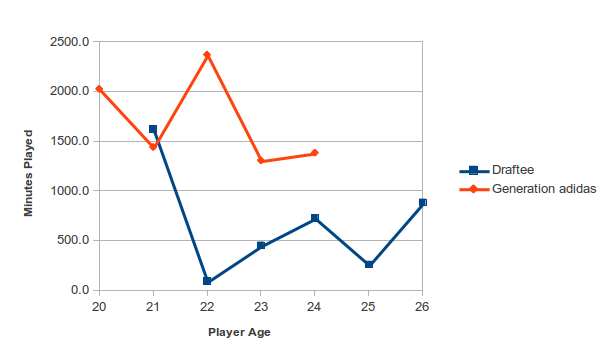
Average minutes played of Draftee and Generation adidas cohorts at the goalkeeper position. Data from MLS regular season, 2007-2012.
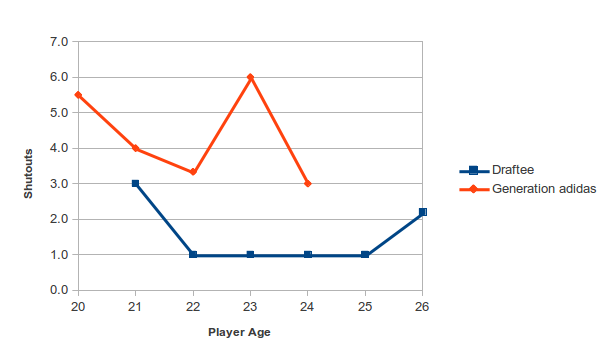
Average shutouts of the Draftee and Generation adidas cohorts at the goalkeeper position. Data from MLS regular season, 2007-2012.
Field Player Analysis
We also identify five distinct groups among the field position players who have played in MLS between 2007-2012, whose characteristics are presented in the table below. The principal factors that differentiate the five groups are base salary, minutes played, matches played, and goals scored.
| Group Description | Average Characteristics |
| Draftees, low price players | Base $65k, 25 y/o, 17 matches, 1130 minutes, 1 goal, 0.9 assists, 5 shots, 15 fouls |
| Legacy (pre-2007) and Foreign free agents | Base $225k, 30 y/o, 22 matches, 1740 minutes, 3 goals, 2 assists, 11 shots, 23 fouls |
| Low-priced DPs, elite domestic players | Base $1.1M, 31 y/o, 21 matches, 1690 minutes, 7 goals, 3 assists, 22 shots, 20 fouls |
| Elite players, mid price DPs | Base $2.5M, 32 y/o, 21 matches, 1705 minutes, 6 goals, 5 assists, 17 shots, 22 fouls |
| Expensive/high profile DPs, former European stars | Base $5.2M, 33 y/o, 16 matches, 1340 minutes, 4 goals, 5 assists, 12 shots, 15 fouls |
The main difference between the Draftee cohort and the Legacy/Foreign Free Agent group is the lack of match experience as expressed by minutes played, matches played, and age. There is less of a difference in match experience between the Legacy/Foreign cohort and the elite groups, but significant differences in output. Another interpretation of the cluster analysis is that MLS has a multiple pay band for its Designated Players — lowest band for players from the mid-level European leagues, middle band for the highest-paid Designated Players who don’t have broad commercial appeal, and the highest band for those DPs who were last playing for major European clubs.
When we take a slice of statistical data across ages, we see that once again there are significant differences in pay levels between the Draftee cohort and either Foreign Free Agents or Generation adidas players. The first figure below compares the minutes played between Draftees and Foreign Free Agents, and the main feature of the graph is the difference in minutes played between ages 21 and 24. (The huge spike at age 19 in the Draftee plot is because of Joao Plata’s season in 2011.) It’s possible that this gap in minutes played accounts for the lag in goals scored and shots produced by members of the Draftee group between these ages, but that gets into the whole causation-vs-correlation issue.
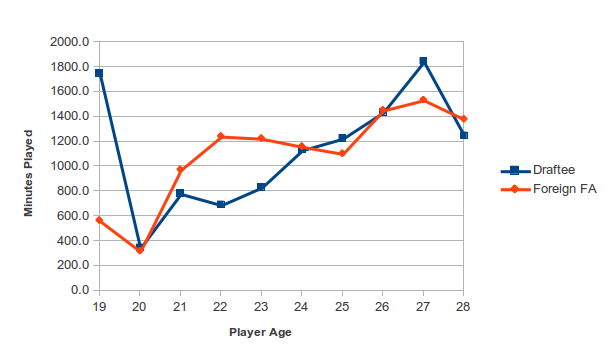
Average minutes played of the Draftee and Foreign Free Agent cohorts for all field players. Data from MLS regular season, 2007-2012.
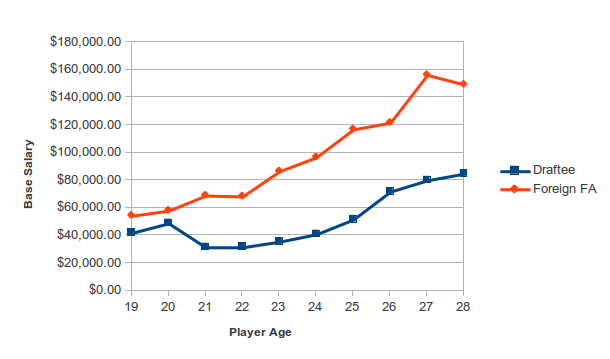
Average base salary for the Draftee and Foreign Free Agent cohorts for all field players. Data from MLS regular season, 2007-2012.
Draftee players are able to reach parity in minutes played by age 24 or 25, but the gap in on-field performance takes longer to close, and in the case of goals, it appears that it does not close.
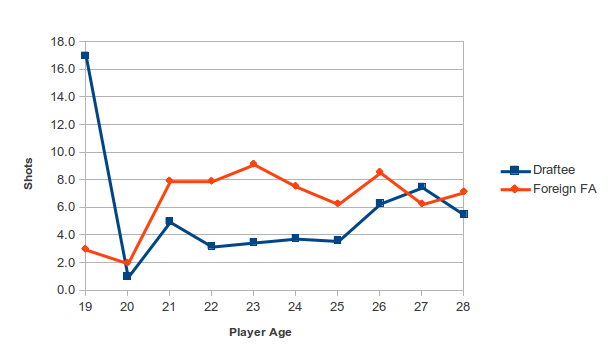
Average shots of Draftee and Foreign Free Agent cohorts for all field players. Data from MLS regular season, 2007-2012.
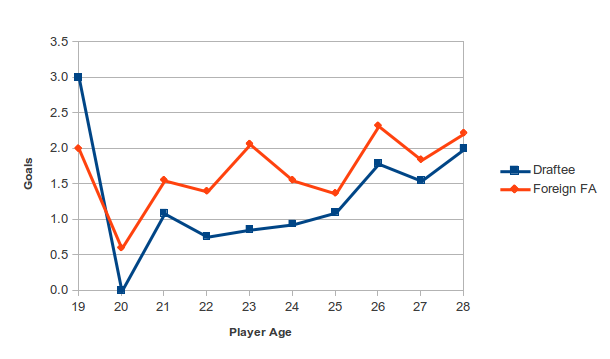
Average goals of the Draftee and Foreign Free Agent cohorts for all field players. Data from MLS regular season, 2007-2012.
Concluding Remarks
There are so many caveats that you can throw at this kind of analysis, and to be honest there is so much more to be done in terms of longitudinal studies of player performance. We’ve gone through a generation and a half since data tracking became more widely used in football, so we are still crawling along before we can walk, run, and fly.
It does appear that there is a gap in expectations (proxied by base salary and minutes played) and performance of players who enter MLS via the college draft and those who enter it via other channels. That gap persists over a long term and in some cases it’s never closed. Now, there are players who have entered the MLS through the college draft and became elite players, but most of those players went on to play overseas within 3-4 seasons. So there is almost certainly a selection bias present in these results.
So to return to Drew Carey’s assertion about college players and MLS, there does exist a gap in performance, but there are so many explanations for it that a more complete analysis of player performance over a career is necessary.
[Special thanks to Aaron for providing access to his huge soccer database, and thanks to the members of our Data Intelligence team — Ryan Sonnet, Khaldoon Abu-Hakmeh, Pavel Nekrasov, Billy Marsden, Duane Rollins, Paul Foster, and Tuuwala Lok — for sourcing and verifying bio/demographic data on the players.]
