Is there a relationship between “mean-time-between” metrics and effective time?
Categories: Match Quality Metrics, Referee Performance, Team Performance
Since I started to apply mean time between fouls and mean time between stoppages to World Cup data, I was curious to find out if there was any correlation between these “mean-time-between” metrics and the effective match time. I’ll examine the correlation issues in this post.
For reference, here is my post on MTBF for the 2014 FIFA World Cup, the post on MTBS for the World Cup, and the (adjusted) effective match times for all World Cup matches.
Below is a plot of MTBF versus effective time over all matches of the 2014 FIFA World Cup for regulation time only. Both metrics are given in seconds.
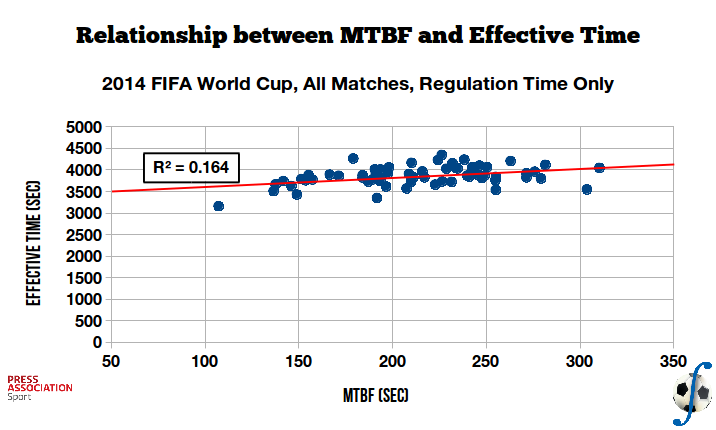
Relationship between mean time between fouls and effective match time, over regulation time of all 2014 FIFA World Cup matches. (Data sourced from Press Association Sport.)
If one attempts to fit a linear model to the plot, the coefficient of determination is \(R^2 = 0.164\), which means that the correlation coefficient is \(r = 0.405\). There appears to not be a strong relationship between mean time between fouls and effective match time, but not a weak one, either.
(For the statisticians in the audience, I did make a plot of the centered metrics (i.e., removed the means) and found out that the correlation coefficient was identical.)
It’s useful to test whether the relationship between two variables is significantly different from random, or in more statistical language, whether the true correlation coefficient is zero (the null hypothesis). To do so I conduct a t-test on the correlation coefficient and obtain \(t(62) = 3.49\), which gives support to the correlation coefficient being significant at the 1% level \((t(p=0.01) = 2.66)\).
The second plot is MTBS versus effective time, over the same matches and conditions as the first plot.
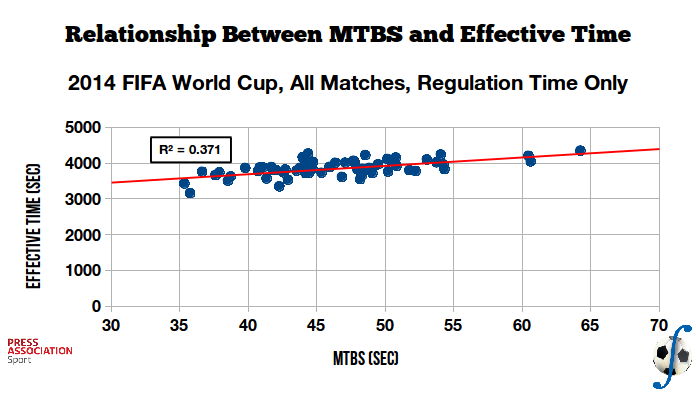
Relationship between mean time between stoppages and effective match time, over regulation time of all 2014 FIFA World Cup matches. (Data sourced from Press Association Sport)
For this case the coefficient of determination is \(R^2 = 0.371\), which means that the correlation coefficient is \(r = 0.609\). A much stronger linear relationship between mean time between stoppages and effective time. I’d conjecture that if foul events were removed from the MTBS calculation, the correlation would be stronger still.
To convince myself that the calculated coefficient is significant, I run a t-test. For this relationship I get \(t(62) = 6.05\), which gives very strong support to the correlation coefficient being significant at the 1% level.
In my view, the relatively weaker correlation between MTBF and effective time during the World Cup lends some support to the match referee having less influence on the amount of effective playing time than the two teams involved, but he does have some influence. In league play, during which a referee may work 20-30 matches, these variations will cancel out, but during a short tournament, deviations can be significant. In the end, it will be the two teams that will have the strongest influence on how flowing or choppy a match will be, or on how even- or bad-tempered a match will become. The relationship between MTBS and effective time reflects that analysis.
