A first look at MTBF for the 2014 World Cup
Categories: Match Quality Metrics, Referee Performance, Team Performance
In my previous post I introduced the concept of mean time between fouls and mean time between stoppages. In this post I calculate mean time between fouls over all matches of the 2014 FIFA World Cup.
The data are taken from Press Association‘s Match Story feed of the World Cup, which is ingested into the Soccermetrics Connect API. Calculation of MTBF is straightforward — determine those in-match events which are fouls, calculate the intervals between the times of fouls for each period of the match, and calculate the arithmetic mean of those intervals. Below is a table of MTBF for regulation time periods of every match of the World Cup:
| Home Team | Away Team | Referee | 1st Half Fouls | 1st Half MTBF (secs) | 2nd Half Fouls | 2nd Half MTBF (secs) |
|---|---|---|---|---|---|---|
| Korea Republic | Algeria | Wilmar Roldán | 12 | 225.27 | 15 | 189.64 |
| Costa Rica | Greece | Ben Williams | 13 | 230.92 | 16 | 188.80 |
| Netherlands | Chile | Bakary Gassama | 21 | 131.05 | 16 | 144.07 |
| Côte d’Ivoire | Japan | Enrique Osses | 8 | 241.14 | 12 | 222.73 |
| Japan | Colombia | Pedro Proença | 15 | 191.93 | 11 | 253.50 |
| Argentina | Iran | Milorad Mažić | 12 | 251.82 | 9 | 311.25 |
| Australia | Spain | Nawaf Shukralla | 14 | 204.31 | 10 | 296.56 |
| Croatia | Mexico | Ravshan Irmatov | 14 | 201.69 | 12 | 251.18 |
| Greece | Côte d’Ivoire | Carlos Vera | 15 | 205.00 | 13 | 217.17 |
| Nigeria | Bosnia and Herzegovina | Peter O’Leary | 5 | 234.50 | 11 | 217.90 |
| Iran | Nigeria | Carlos Vera | 12 | 213.82 | 17 | 167.25 |
| Germany | Ghana | Sandro Ricci | 10 | 257.67 | 18 | 159.76 |
| Brazil | Chile | Howard Webb | 19 | 131.17 | 12 | 242.82 |
| Russia | Korea Republic | Néstor Pitana | 10 | 221.11 | 12 | 236.27 |
| Ghana | USA | Jonas Eriksson | 12 | 241.73 | 11 | 243.20 |
| Switzerland | France | Björn Kuipers | 11 | 180.90 | 13 | 197.83 |
| Italy | Costa Rica | Enrique Osses | 14 | 193.92 | 16 | 164.07 |
| France | Honduras | Sandro Ricci | 14 | 203.15 | 14 | 191.85 |
| Brazil | Colombia | Carlos Velasco | 26 | 106.80 | 28 | 107.56 |
| Ecuador | France | Noumandiez Doué | 12 | 227.09 | 9 | 324.75 |
| Brazil | Mexico | Cüneyt Çakır | 16 | 174.93 | 13 | 221.17 |
| USA | Germany | Ravshan Irmatov | 10 | 271.33 | 13 | 177.00 |
| France | Germany | Néstor Pitana | 11 | 227.70 | 20 | 140.32 |
| Netherlands | Costa Rica | Ravshan Irmatov | 13 | 213.83 | 9 | 296.62 |
| Korea Republic | Belgium | Ben Williams | 18 | 155.94 | 8 | 387.00 |
| Germany | Argentina | Nicola Rizzoli | 9 | 287.62 | 12 | 202.55 |
| Colombia | Greece | Mark Geiger | 11 | 251.70 | 21 | 130.30 |
| Netherlands | Argentina | Cüneyt Çakır | 11 | 214.40 | 9 | 278.50 |
| Spain | Netherlands | Nicola Rizzoli | 13 | 226.50 | 8 | 380.86 |
| Colombia | Côte d’Ivoire | Howard Webb | 12 | 174.18 | 14 | 218.92 |
| Switzerland | Ecuador | Ravshan Irmatov | 13 | 219.67 | 10 | 262.33 |
| Australia | Netherlands | Djamel Haimoudi | 22 | 128.24 | 20 | 144.79 |
| Brazil | Croatia | Yuichi Nishimura | 8 | 362.86 | 16 | 147.20 |
| Honduras | Switzerland | Néstor Pitana | 17 | 163.06 | 11 | 268.70 |
| Cameroon | Brazil | Jonas Eriksson | 12 | 231.73 | 19 | 151.67 |
| Japan | Greece | Joel Aguilar | 20 | 138.53 | 18 | 164.18 |
| Germany | Algeria | Sandro Ricci | 11 | 263.90 | 12 | 221.00 |
| Spain | Chile | Mark Geiger | 17 | 166.38 | 9 | 328.88 |
| Belgium | USA | Djamel Haimoudi | 16 | 177.93 | 10 | 242.33 |
| Colombia | Uruguay | Björn Kuipers | 13 | 214.92 | 13 | 219.08 |
| Uruguay | Costa Rica | Felix Brych | 16 | 152.73 | 20 | 145.16 |
| Germany | Portugal | Milorad Mažić | 11 | 191.90 | 10 | 293.00 |
| Brazil | Netherlands | Djamel Haimoudi | 17 | 153.69 | 17 | 179.25 |
| Mexico | Cameroon | Wilmar Roldán | 13 | 211.83 | 8 | 331.00 |
| Argentina | Switzerland | Jonas Eriksson | 21 | 129.95 | 17 | 162.06 |
| France | Nigeria | Mark Geiger | 11 | 271.90 | 13 | 207.67 |
| Chile | Australia | Noumandiez Doué | 14 | 197.46 | 11 | 189.50 |
| Argentina | Bosnia and Herzegovina | Joel Aguilar | 13 | 205.58 | 10 | 261.67 |
| Algeria | Russia | Cüneyt Çakır | 13 | 184.50 | 16 | 183.47 |
| Bosnia and Herzegovina | Iran | Wilmar Roldán | 20 | 128.63 | 16 | 178.60 |
| Belgium | Algeria | Marco Antonio Rodríguez | 14 | 189.00 | 23 | 125.50 |
| Uruguay | England | Carlos Velasco | 14 | 176.77 | 12 | 208.73 |
| Honduras | Ecuador | Ben Williams | 14 | 216.62 | 17 | 170.44 |
| Italy | Uruguay | Marco Antonio Rodríguez | 23 | 123.00 | 14 | 219.69 |
| Cameroon | Croatia | Pedro Proença | 11 | 228.40 | 9 | 281.38 |
| England | Italy | Björn Kuipers | 11 | 226.90 | 8 | 299.00 |
| Brazil | Germany | Marco Antonio Rodríguez | 11 | 219.30 | 12 | 243.64 |
| Belgium | Russia | Felix Brych | 12 | 206.91 | 10 | 291.11 |
| Portugal | Ghana | Nawaf Shukralla | 18 | 117.35 | 18 | 166.12 |
| USA | Portugal | Néstor Pitana | 13 | 223.92 | 10 | 252.56 |
| Nigeria | Argentina | Nicola Rizzoli | 12 | 240.55 | 10 | 317.78 |
| Netherlands | Mexico | Pedro Proença | 8 | 319.14 | 10 | 301.56 |
| Argentina | Belgium | Nicola Rizzoli | 10 | 300.44 | 16 | 168.93 |
| Costa Rica | England | Djamel Haimoudi | 14 | 184.00 | 20 | 126.37 |
Mean time between fouls of all matches at 2014 FIFA World Cup, regulation time only. Data sourced from Press Association MatchStory feed and served from Soccermetrics Connect API.
Over all of the matches of the World Cup, the mean time between fouls for each period varies as displayed in the figure below. The chart indicates that fouls are whistled approximately three and one-half minutes apart (205.6 seconds) in the first half, and that interval widens in the second period (222.1 seconds) and even further during the extra time periods (231.8 and 280.5, respectively). So does the referee swallow the whistle during extra time? It’s tempting to conclude that by looking at the mean values, but the error bars caution otherwise. There are fewer data points available for extra time matches — only eight matches in World Cup 2014 went to extra time — and even if you consider the shorter length of the period which would give teams less of an opportunity to foul, teams tend to be more reluctant in those extra time periods, anyway. Of course, the second part of that last sentence was an assertion. There aren’t enough data to make a strong conclusion.
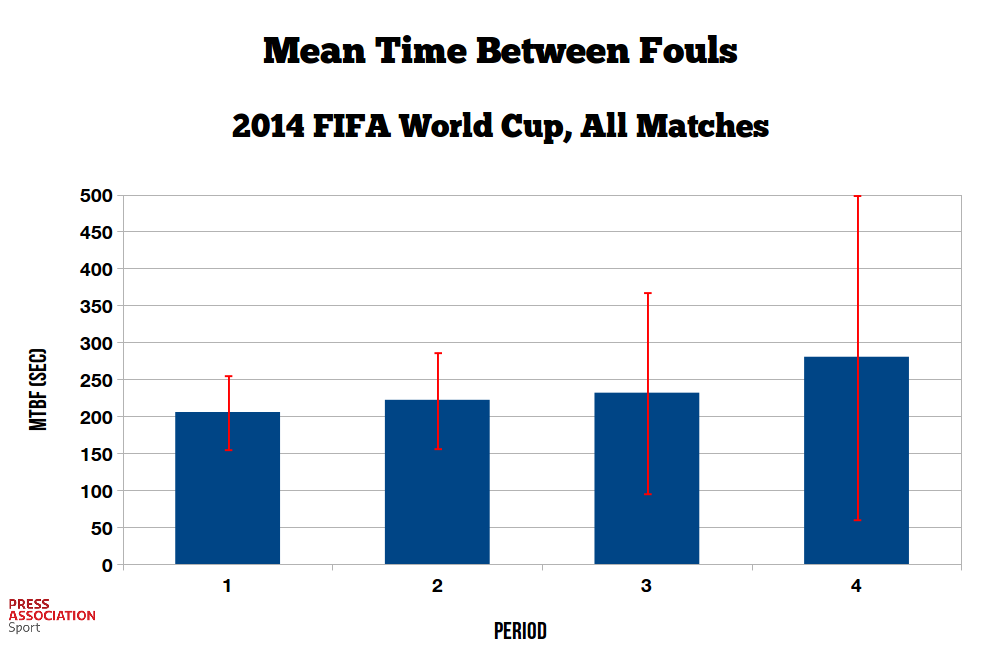
Mean time between fouls (MTBF) over all matches of the 2014 FIFA World Cup.
Let’s examine the metric for the regulation time periods 1 and 2. The chart below displays the average MTBF during the regulation periods over all of the matches officiated by a match referee, then columns for the average over the 90 minutes and the difference in MTBF between the first and second halves. Now, a low MTBF could be a result of a bad-tempered match between the two teams in the match, and we would need further analysis to estimate contributions by the teams and the referee. But I would argue that a significant change in MTBF indicates a tendency of a match referee to call a match one way during the first half and then loosen or tighten control during the second period.
In that light, the performance of Yuichi Nishimura stands out in a very big way. The first half of his match between Brazil and Croatia — the opening match of the 2014 FIFA World Cup — was called very loosely. The mean time between fouls called in that half was six minutes two seconds, over thirty seconds longer than the first half of any other World Cup match. As if to compensate for such permissiveness, he called the second half very tight — the MTBF was almost two and a half minutes, which was the 9th tightest second half of the 64 matches. Even if you look at matches on an individual level (which will be the subject of an upcoming post), only two other matches experience a change in MTBF as significant as the Brazil-Croatia match.
Nicola Rizzoli, who refereed the final, had on average the highest MTBF over regulation time, but even this figure is a little misleading. Rizzoli was in charge of the Argentina-Belgium quarterfinal, which was first refereed loosely in the first half (300.44 seconds) and very tight in the second half (168.93 seconds). How much of that swing in MTBF had to do with the two teams, and how much of that had to do with Rizzoli being a little stricter? It’s hard to say. I think it’s a good thing that Rizzoli appears to call a consistent match over both halves, and that’s probably a reflection of his high regard within the international game, but one needs a larger body of work than four matches to be sure.
| Avg MTBF (sec) | |||||
| Referee | Matches | First Half | Second Half | 90 Mins | Diff |
| Nicola Rizzoli | 4 | 263.8 | 267.5 | 265.7 | 3.8 |
| Pedro Proença | 3 | 246.5 | 278.8 | 262.7 | 32.3 |
| Milorad Mažić | 2 | 221.9 | 302.1 | 262.0 | 80.3 |
| Yuichi Nishimura | 1 | 362.9 | 147.2 | 255.0 | -215.7 |
| Ravshan Irmatov | 4 | 226.6 | 246.8 | 236.7 | 20.2 |
| Noumandiez Doué | 2 | 212.3 | 257.1 | 234.7 | 44.9 |
| Peter O’Leary | 1 | 234.5 | 217.9 | 226.2 | -16.6 |
| Mark Geiger | 3 | 230.0 | 222.3 | 226.1 | -7.7 |
| Ben Williams | 3 | 201.2 | 248.7 | 225.0 | 47.6 |
| Björn Kuipers | 3 | 207.6 | 238.6 | 223.1 | 31.1 |
| Néstor Pitana | 4 | 208.9 | 224.5 | 216.7 | 15.5 |
| Sandro Ricci | 3 | 241.6 | 190.9 | 216.2 | -50.7 |
| Wilmar Roldán | 3 | 188.6 | 233.1 | 210.8 | 44.5 |
| Cüneyt Çakır | 3 | 191.3 | 227.7 | 209.5 | 36.4 |
| Enrique Osses | 2 | 217.5 | 193.4 | 205.5 | -24.1 |
| Carlos Vera | 2 | 209.4 | 192.2 | 200.8 | -17.2 |
| Felix Brych | 2 | 179.8 | 218.1 | 199.0 | 38.3 |
| Nawaf Shukralla | 2 | 160.8 | 231.3 | 196.1 | 70.5 |
| Jonas Eriksson | 3 | 201.1 | 185.6 | 193.4 | -15.5 |
| Joel Aguilar | 2 | 172.1 | 212.9 | 192.5 | 40.9 |
| Howard Webb | 2 | 152.7 | 230.9 | 191.8 | 78.2 |
| Marco Antonio Rodríguez | 3 | 177.1 | 196.3 | 186.7 | 19.2 |
| Djamel Haimoudi | 4 | 161.0 | 173.2 | 167.1 | 12.2 |
| Carlos Velasco | 2 | 141.8 | 158.1 | 150.0 | 16.4 |
| Bakary Gassama | 1 | 131.1 | 144.1 | 137.6 | 13.0 |
Below is the average MTBF during the regulation periods over all of the matches involving the World Cup teams. As with referees, teams involved in matches with infrequent fouling tend to reverse their behavior in the second half, and vice-versa. The overall tendency is for the time between fouls to increase, but for seven of the eight sides with the shortest MTBF in the second half, all of them participated in matches in which the average frequency of fouls increased from the first half to the second. All of the ten sides with the longest MTBF in the second half experienced a decrease in the average frequency of fouls from the opening period to the next.
| Avg MTBF (sec) | |||||
| Team | Matches | First Half | Second Half | 90 Mins | Diff |
| Spain | 3 | 199.1 | 335.4 | 267.2 | 136.4 |
| Mexico | 4 | 226.9 | 276.2 | 251.6 | 49.3 |
| Croatia | 3 | 264.3 | 226.6 | 245.5 | -37.7 |
| Cameroon | 3 | 224.0 | 254.7 | 239.3 | 30.7 |
| Argentina | 7 | 232.9 | 243.2 | 238.1 | 10.3 |
| Ecuador | 3 | 221.1 | 252.5 | 236.8 | 31.4 |
| Korea Republic | 3 | 200.8 | 271.0 | 235.9 | 70.2 |
| Nigeria | 4 | 240.2 | 227.7 | 233.9 | -12.5 |
| USA | 4 | 228.7 | 228.8 | 228.8 | 0.0 |
| Germany | 7 | 245.6 | 205.3 | 225.5 | -40.3 |
| Belgium | 5 | 206.0 | 243.0 | 224.5 | 36.9 |
| Netherlands | 7 | 198.1 | 246.5 | 222.3 | 48.4 |
| Russia | 3 | 204.2 | 237.0 | 220.6 | 32.8 |
| France | 5 | 222.1 | 212.5 | 217.3 | -9.7 |
| Côte d’Ivoire | 3 | 206.8 | 219.6 | 213.2 | 12.8 |
| Iran | 3 | 198.1 | 219.0 | 208.6 | 20.9 |
| Portugal | 3 | 177.7 | 237.2 | 207.5 | 59.5 |
| Bosnia and Herzegovina | 3 | 189.6 | 219.4 | 204.5 | 29.8 |
| Italy | 3 | 181.3 | 227.6 | 204.4 | 46.3 |
| England | 3 | 195.9 | 211.4 | 203.6 | 15.5 |
| Honduras | 3 | 194.3 | 210.3 | 202.3 | 16.1 |
| Japan | 3 | 190.5 | 213.5 | 202.0 | 22.9 |
| Switzerland | 4 | 173.4 | 222.7 | 198.1 | 49.3 |
| Algeria | 4 | 215.7 | 179.9 | 197.8 | -35.8 |
| Ghana | 3 | 205.6 | 189.7 | 197.6 | -15.9 |
| Australia | 3 | 176.7 | 210.3 | 193.5 | 33.6 |
| Chile | 4 | 156.5 | 226.3 | 191.4 | 69.8 |
| Brazil | 7 | 197.2 | 184.8 | 191.0 | -12.5 |
| Greece | 4 | 206.5 | 175.1 | 190.8 | -31.4 |
| Costa Rica | 5 | 195.1 | 184.2 | 189.6 | -10.9 |
| Colombia | 5 | 187.9 | 185.9 | 186.9 | -2.0 |
| Uruguay | 4 | 166.9 | 198.2 | 182.5 | 31.3 |
I’ll revisit the MTBF during extra time and attempt to extract the contributions of the teams and referees to the metric in a future post.
UPDATE (27 Oct, 21:44): I have merged the first and second half tables for referees and teams. Hopefully these changes will communicate the metric more easily.
