Does the match referee affect effective time?
Categories: Match Quality Metrics, Referee Performance
I’ve been banging on the “Hey, let’s model effective match time!” drum for a few posts now, and I’m ready to move on to something else, but I want to present one more extension. You can read some of my previous work in the Match Quality Metrics category of the blog.
I want to answer this question: Does the identity of the match referee have any impact on the amount of effective time in a match? The answer to that question holds much interest to the football community, from football fans and club officials to the media and the league organizations. The officials with the league office would prefer (and assert) that their referees have no impact on the pace of play; perhaps fans and club officials would believe differently, especially in the case of match referees they hold under suspicion.
To assist in answering this question, I create a model of effective playing time that accounts for the identity of the opposing teams and the match referee. It is:
![]()
where T = effective match time relative to mean effective time (over all league matches) in seconds, t0 = the estimate of the intercept, x = the team involved in the match (i = home team, j = away team), r = the referee involved in the match, and α = the team’s influence on the amount of effective match time relative to an average league match.
I used data from the 2010-11 English Premier League and the details for fitting the model are similar to previous studies. You can read the technical information in this post (and this post, too) if you want to learn more.
My expectation is that very few of the match referees would influence the effective time in a significant way; in other words, their respective regression coefficients would not be significantly different from zero. The team influences on effective time would be relatively unchanged.
The regression results showed that knowledge of the two participating teams and the match referee in a Premier League match influenced 20-40% of the variation in the effective match time. (This is the standard R² value that we are referring to.) Much more interesting is the adjusted R² value, which compares the predictive quality of models with different sets of regressors. This value decreased when referee identity was added to the model. That’s not very reassuring about the predictive quality of the updated model. (I know that I need to insert a figure to illustrate this point, and I’ll do so later.)
The coefficients associated with the Premier League teams were for the most part similar to those generated for the original regression model. Table 1 displays the mean values of the coefficients and their standard errors, and Figure 1 illustrates them. Manchester United had the greatest positive impact on effective time in 2010-11 — three to four more minutes than the average League match, and even after controlling for referee identity the magnitude is not significantly different from that from the previous model. Stoke City had the greatest negative impact on effective time — three to four fewer minutes than the average League match. The magnitude of each team’s influence on effective time didn’t change much when referee identity is added, with the exception of Everton, whose influence became akin to that of Stoke or Bolton.
| Club | EPT Impact (sec) | Std Error (secs) |
| Manchester United | 203.2 | 38.5 |
| Arsenal | 174.4 | 37.8 |
| Chelsea | 136.1 | 37.5 |
| Manchester City | 127.3 | 37.7 |
| Fulham | 126.8 | 41.5 |
| Tottenham Hotspur | 97.1 | 39.6 |
| Liverpool | 88.4 | 39.4 |
| West Ham United | 46.7 | 38.5 |
| Birmingham City | 22.0 | 39.9 |
| West Bromwich Albion | 16.1 | 36.7 |
| Blackpool | 9.6 | 39.3 |
| Sunderland | -45.6 | 41.0 |
| Wolverhampton Wanderers | -46.8 | 36.6 |
| Wigan Athletic | -58.7 | 38.4 |
| Aston Villa | -93.0 | 39.2 |
| Newcastle United | -120.7 | 38.8 |
| Blackburn Rovers | -144.7 | 39.6 |
| Everton | -153.1 | 40.3 |
| Bolton Wanderers | -171.4 | 38.0 |
| Stoke City | -201.0 | 36.7 |
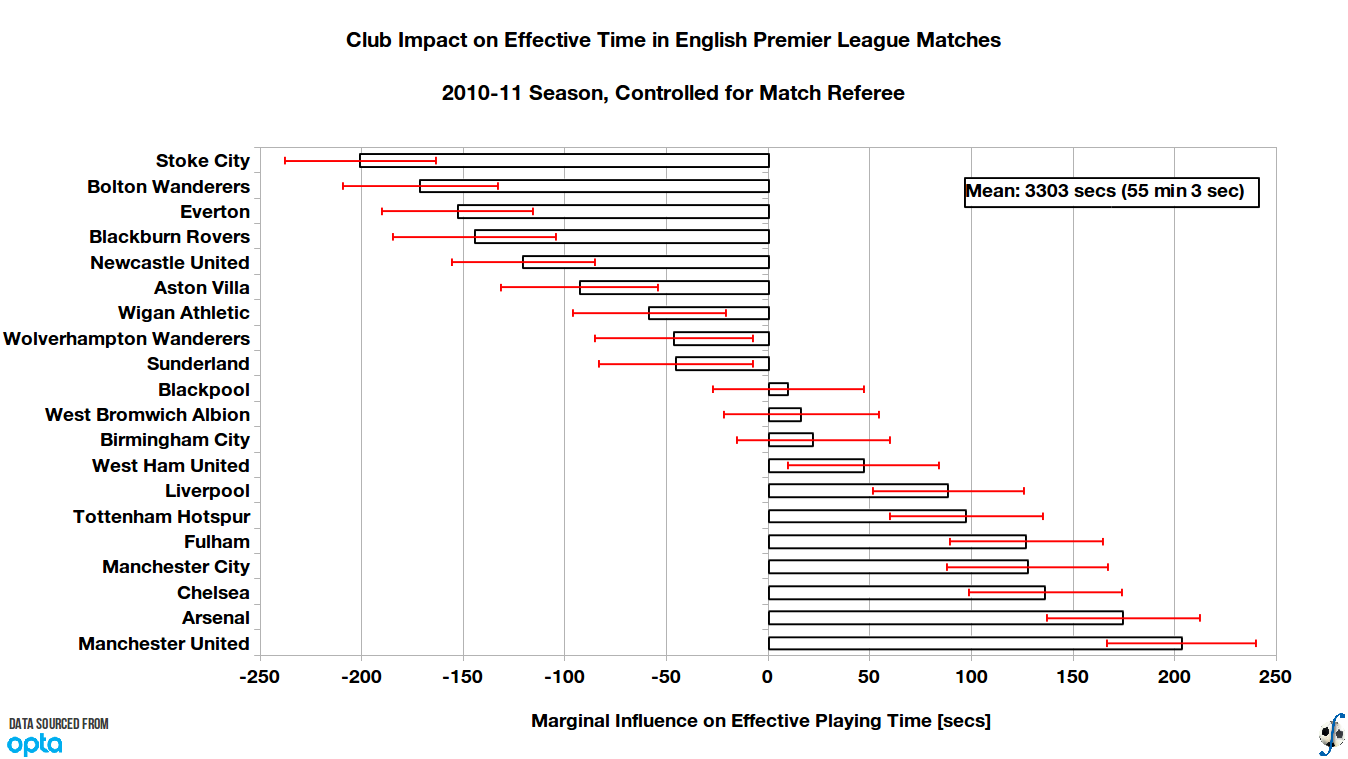
Figure 1. Club influence on effective playing time controlled for match referee and relative to league average in English Premier League, 2010-11 season (final).
The referee influence coefficients show that the large majority had — on average — no significant influence on a League match in 2010-11. In matches the amount of effective time can be greater or less than average due to other factors, such as the frequency of stoppages and fouls, the match tempo of the two teams, or weather conditions.
While these factors might explain the larger standard errors associated with the coefficients, a strong correlation (close to 70%) can be found between the standard errors and the number of League matches worked by the referees. Jonathan Moss and Neil Swarbrick officiated two matches each during the 2010/11 season and had the highest uncertainties in their corresponding coefficients. Phil Dowd and Mike Dean worked 30 matches and had the smallest standard errors associated with their coefficients. The standard errors of the remaining referees fell in line, but even so their average influence coefficients were so small that they were washed out by their standard errors.
In the end only two match referees during the 2010-11 season had influence coefficients that were significantly different from zero (thus rejecting the null hypothesis): Peter Walton, whose presence in a match added almost 90 seconds of effective time relative to the average Premier League match (t(21)=1.84, p<0.080), and Kevin Friend, whose presence in a match reduced effective time by 100 seconds relative to the average Premier League match (t(21)=-1.86, p<0.077). (Incidentally, Peter Walton is now general manager of the Professional Referees Organization in the USA and Canada.)
| Referee | EPT Impact (sec) | Std Error (secs) |
| Jonathan Moss | 93.0 | 128.5 |
| Peter Walton | 86.2 | 46.8 |
| Mark Clattenburg | 63.1 | 49.0 |
| Neil Swarbrick | 52.4 | 152.9 |
| Lee Probert | 43.5 | 51.0 |
| Chris Foy | 30.2 | 49.2 |
| Andre Marriner | 20.7 | 47.5 |
| Michael Oliver | -0.5 | 55.1 |
| Mike Jones | -1.6 | 46.0 |
| Anthony Taylor | -2.3 | 66.4 |
| Mike Dean | -10.9 | 41.9 |
| Mark Halsey | -13.3 | 48.8 |
| Martin Atkinson | -29.1 | 45.3 |
| Stuart Attwell | -40.5 | 62.1 |
| Phil Dowd | -40.7 | 44.6 |
| Lee Mason | -68.7 | 49.2 |
| Howard Webb | -75.2 | 46.4 |
| Kevin Friend | -99.9 | 53.8 |
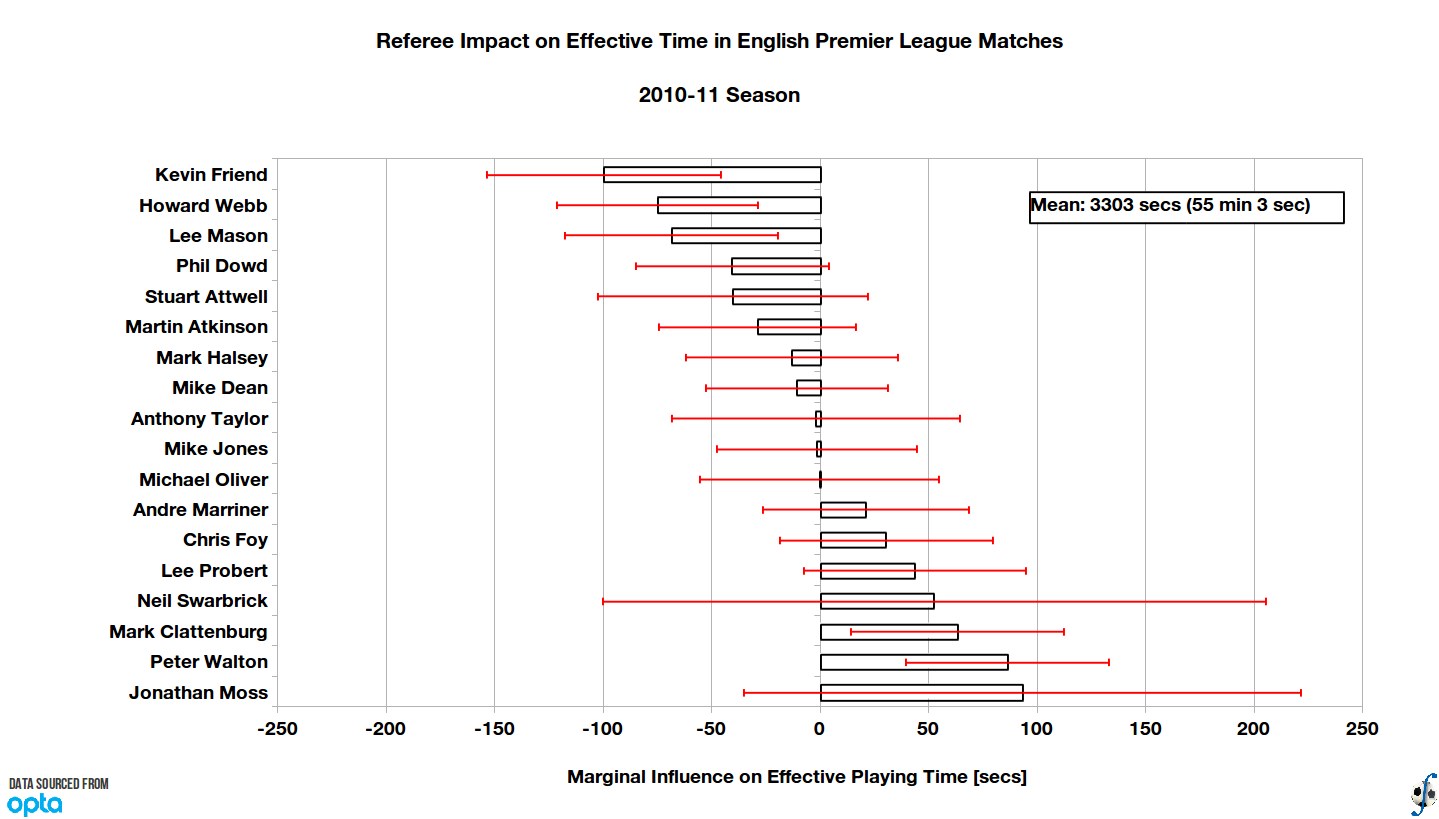
Figure 2. Referee influence on effective playing time relative to league average in English Premier League, 2010-11 season (final).
This study covers only one season in one competition, so one needs to be careful with any conclusions drawn. It is fascinating that knowledge of the two competing teams can predict effective match time with a fair degree of predictive power. It is also fascinating how well a team’s influence on effective time relative to the league average correlates with other quantities such as match tempo or passes per possession. Yet the influence of match referees on the amount of playing time is inconsistent, even for those referees in charge of a higher proportion of matches. So to return to our motivating question, “Does the identity of the match referee have any impact on the amount of effective time in a match?”, the answer would have to be “No, not in this case.” I imagine that the league office would like that.
