Effective time in the J-League, part 2
Categories: Match Quality Metrics
Back in July I wrote about the variations in effective match time in Divisions 1 and 2 of the J-League — the professional leagues of Japanese club football. The J-League has taken a keen interest in measuring effective time as part of their Plus Quality initiative to identify and minimize those events in a football match that make it less enjoyable for spectators. Now that the league season is over, it’s time to revisit the data.
The first plot (Figure 1) is the effective time distribution for all matches of the 2013 J-League Division One season. The second (Figure 2) is the distribution for all 2013 matches in J-League Division Two. Both divisions see playing time between similar extremes in the 40 to 70 minute range, but the mean effective match time in Division One is two and a half minutes greater than Division Two (55:43 to 53:13, respectively) with a smaller standard deviation (4:31 to 4:51, respectively). Incidentally, the mean effective playing time in J1 this season is greater than the 2011 season and approaches the peak in 2009 of 56 minutes 8 seconds. The extremes of playing time in J1 are unchanged from July — Cerezo Osaka vs Vegalta Sendai (69 minutes 13 seconds) and Shonan Bellmare vs Oita Trinita (42 minutes 10 seconds) — but the extremes in J2 widened a bit since mid-summer: Gamba Osaka vs Mito Hollyhock (67 minutes 24 seconds) and V-Varen Nagasaki vs Fagiano Okayama (40 minutes 42 seconds).
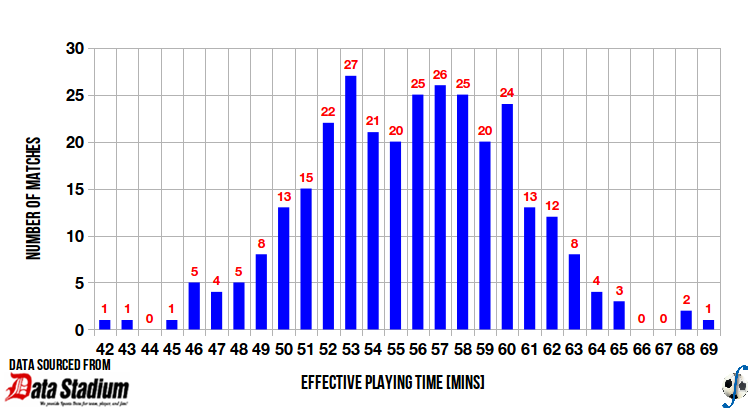
Figure 1. Distribution of effective playing time in J-League Division One, 2013 season (final).
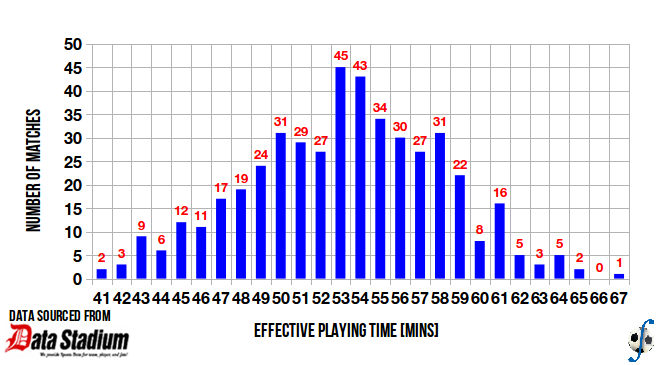
Figure 2. Distribution of effective playing time in J-League Division Two, 2013 season (final).
Now it looks like the effective time data follow a normal distribution, but it’s useful to conduct a normality test to know for sure. The simplest test is a visual inspection of a Q-Q plot, which plots the z-scores (quantiles) of an ordered dataset against the z-scores of a theoretical distribution (in this case, the normal distribution). If the points fall on a 45-degree line that goes through the origin (y=x), we can claim that the data are normally distributed.
Below are the Q-Q plots for J-League Division One (Figure 3) and Division Two (Figure 4). You can observe that the data and theoretical z-scores fall almost on that 45-degree line, with a small bias in the case of the Division Two data. Nevertheless we can claim that the effective match data in the J-League appear to follow a normal distribution.
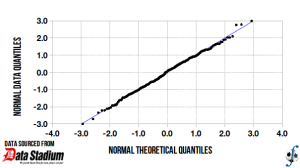
Figure 3. Q-Q plot (normality test) of effective playing time in J-League Division One, 2013 season (final).
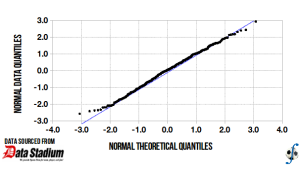
Figure 4. Q-Q plot (normality test) of effective playing time in J-League Division Two, 2013 season (final).
In July I wrote that it would be interesting to see which teams accounted for changes in effective time. It remains interesting in December and in the next post on the subject I’ll present some results that attempt to answer this question.
