Who plays and gets paid more? Player participation in MLS 2014
Categories: Football Business Analytics
I’ve been working on front-office efficiency figures for Major League Soccer in 2014, and while I’ve been putting those results together I wanted to see what kind of information could be shown with the data that I have. One idea that came to mind was to take minutes played data of MLS players in the 2014 regular season and combine those data with salary data. How much do players at certain salary levels participate in league matches?
In this post I present two different types of plots to describe the concentration of players who are paid a certain salary and play a certain range of minutes in Major League Soccer.
I am working with the following data: base salary data of all of the players in the league, published twice a year by the Major League Soccer Players Union, club transaction data for the 2014 season, which is available on the MLS website, and total minutes played by every player on a Major League Soccer roster in 2014, compiled by Aaron Nielsen and generously supplied by him. I consider only those players who have played at least one minute in a league match during the regular season.
As I’ve said in previous posts, salary figures from the MLS Players Union do not fully reflect what players are making or what clubs are paying. For more details on the data’s limitations, consult this post by Steve Fenn. There is one entity that knows exactly what players are paid, but they don’t make their data public, so Players Union data, while imperfect, is the best we have.
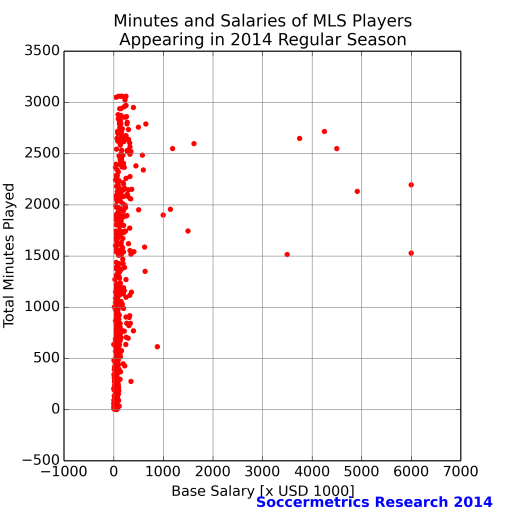
First I present the cluster of base salaries and total minutes played by every player who participated in a MLS match in 2014. The base salaries is pro-rated by the proportion of the season that the player is on the team roster, so I am assuming that if a player has been traded, released, loaned, or chooses to retire, he is no longer on the team’s payroll. Admittedly, this is not necessarily accurate in all situations, but I believe it to be a reasonable assumption until convinced otherwise by people who would know (i.e. MLS officials). (Incidentally, this situation impacts roughly a third of the players.)
(For the uninitiated, base salaries are reported in thousands of US dollars.)
As expected, the overwhelming majority of players in Major League Soccer make less than $300,000 in (prorated) base salary. About 13 players make over a million dollars in base salary, and with one significant exception, all of them played at least 1500 league minutes during the regular season. Half of those players appeared for over 2000 minutes. It’s a very safe bet that all of these players are Designated Players, so it is not all that surprising, and from their clubs’ perspectives more than a little reassuring, that they participated in at least half of their team’s matches. (The lone exception is Jermaine Jones of the New England Revolution, who arrived late in the season on a contract paying $3 million base and played 614 minutes.)
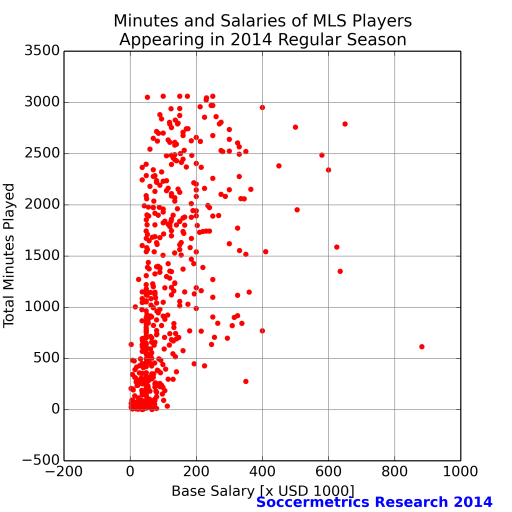
The presence of the Designated Players distorts the salary-minutes cluster, so let’s consider just those players who make less than $1 million base salary. Here is the resulting cluster plot:
The cluster reminds me of a tornado funnel — narrow at the base, and becoming progressively wider toward the top. There is a large cluster of players who earned less than $100,000 base and appear for less than 500 minutes. Even among players who make between $150,000 and $400,000 base there is a wide range of playing time, from around 500 minutes to the season maximum (achieved by five goalkeepers). Beyond $400,000 the amount of playing time increases significantly. (Again, the dot on the far lower right is Jermaine Jones.)
For comparison purposes, here are similar cluster plots for the 2013 MLS season. In the cluster of players making less than $1 million, notice how much wider the cloud is near the base.
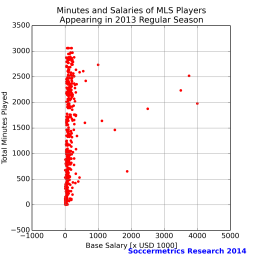
MLS player salary vs minutes played cluster for all players who participated in 2013 regular season matches.
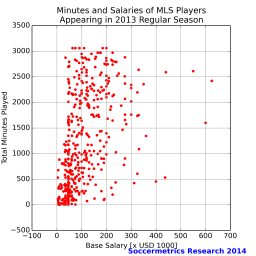
MLS player salary vs minutes played cluster for all players who made less than $1 million base (prorated) and participated in 2013 regular season matches.
Another way to visualize the data is through a density chart, which represents the total number of events within gridded areas. It’s so hard to come up with a descriptive name, and the best that I could think of is “player participation density”, which is the concentration of players who appear for a certain range of minutes in league matches and earn within a certain salary range. In this chart I’ve color coded the grids in single color (light green to dark green). Again, I’m only considering players making less than $1 million base.
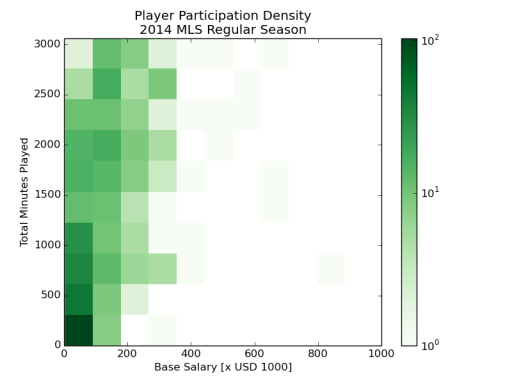
Player participation density for all players who appeared in 2014 MLS regular season making under $1M base salary.
I think this chart communicates that participation in MLS is dominated by players who earn about $350,000 and below, and even more so by players who earn less than $200,000. That band between $90,000 and $180,000 appears very critical to the outcome of a team, since players within this range might not be glamorous (yet) but are expected to play a wide range of minutes.
Again for comparison, a similar chart from the 2013 MLS regular season.
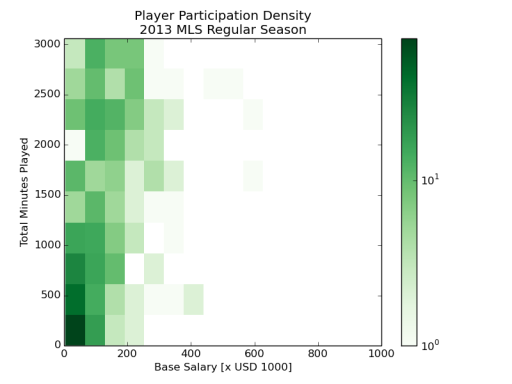
Player participation density for all players in appeared in 2013 MLS regular season making under $1M base salary.
Admittedly this is a different kind of analysis than I usually do, but I hope that these figures illuminate some of the trends that are forming in Major League Soccer over the last two or three seasons.
CORRECTION: I removed the maximum number of minutes that Jermaine Jones could have played; I had forgotten that teams can play zero or multiple league matches in a week.

