MLS Front-Office Efficiency: 2018 edition
Categories: Front-Office Efficiency
The 2018 Major League Soccer regular season ended five weeks ago, and the MLS Cup final is here in Atlanta this weekend! It’s time for a new edition of the Front-Office Efficiency table.
The efficiency metric is version 4.0 which was developed in 2015. You can read more about the process here, but I’ll give a brief description. Front-Office Efficiency is the ratio between a team’s usable payroll (total annualized pay pro-rated by player availability multiplied by the percentage of team payroll used in matches) and the total number of league points won. It is a performance benchmarking tool that is used to identify the organizations at the extremes of performance which merit more sophisticated analysis.
In this version of the metric, only payroll amounts are factored into the financial inputs — not academy spending, which is not made public across the league, nor transfer fee spending, which MLS teams have avoided until very recently, nor the use of General or Targeted Allocation Money. I am very aware of the issues with the salaries reported by the MLS Players Union, but in my opinion, they’re better than nothing and I want to focus more on trends.
Here are my main observations from this year’s results:
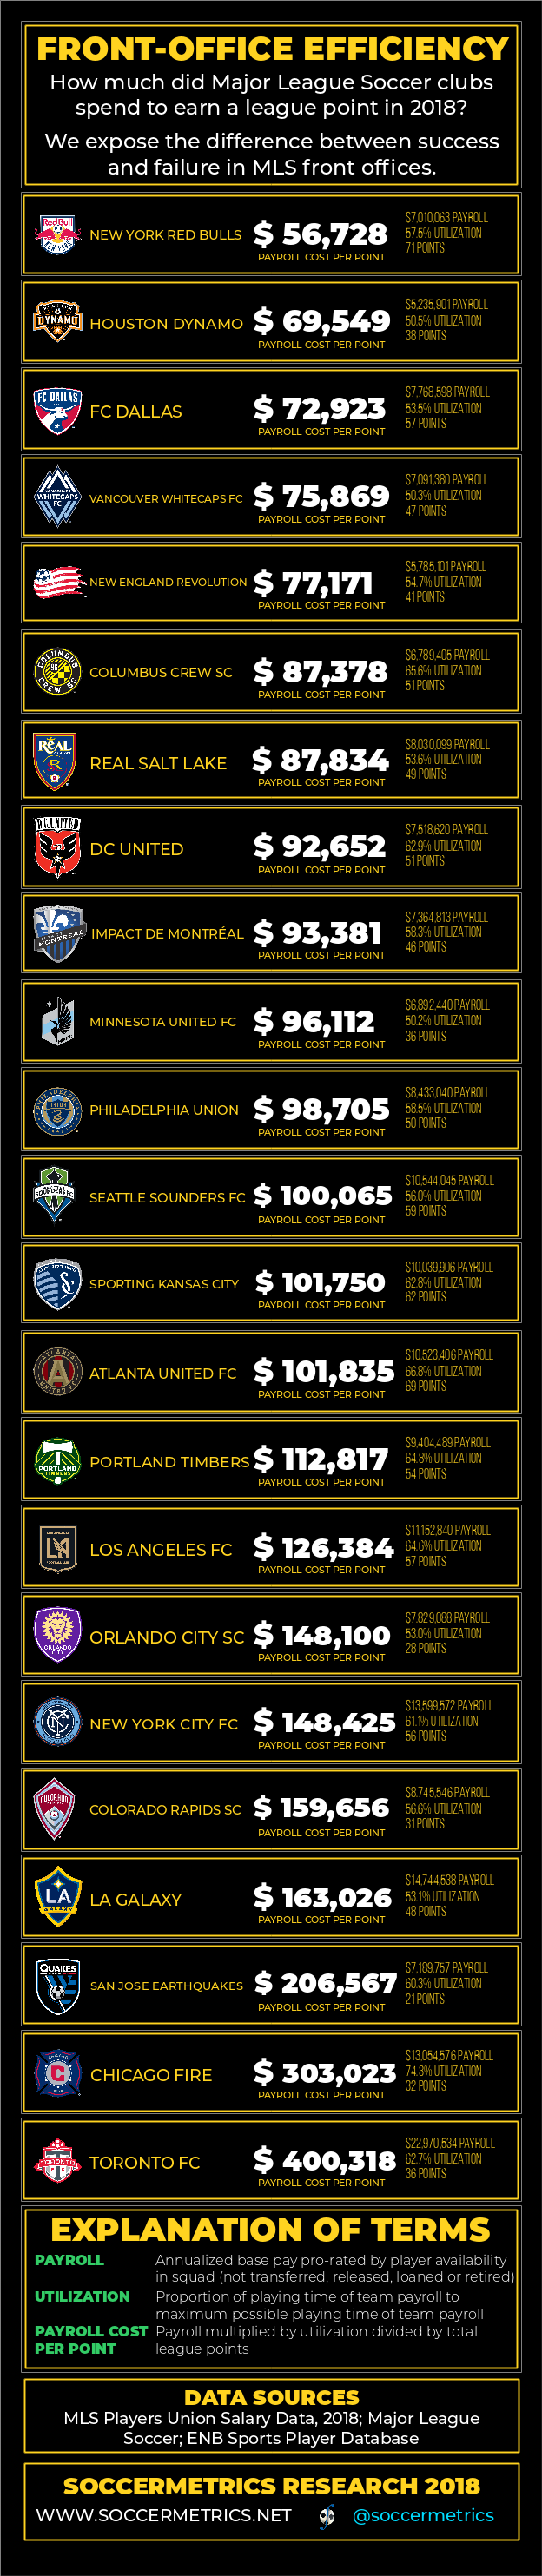
- If last year’s Front-Office Efficiency list revealed a lot of movement among teams, this year’s list saw a lot more stability. Houston, Dallas, and Vancouver occupied positions 2, 3, and 4 on this season’s list at spends of $69-75k per league point. Columbus slipped a bit from second to sixth, while DC United dropped from sixth to eighth and Montreal from tenth to ninth.
- The really big positive movers on the list were Real Salt Lake, whose payroll cost per point remained flat in the midst of increased spending elsewhere; New England, who had the smallest usable payroll in the league; and New York Red Bulls, who won the Supporters’ Shield with a record point total. Only one of those three sides could claim to have had an excellent regular season — New England were far away from the playoff chase, and RSL only backed into the playoffs thanks to a dramatic collapse by the Galaxy on the final day.
- Last year, Minnesota United had the fourth-lowest payroll cost per point in the league. This year, their usable payroll increased by 40%, their payroll utilization rate dropped to the lowest in the league at 50.2%, and the total league points won was unchanged from last year (36), which resulted in the 10th-lowest payroll cost at $96k per point.
- There are more teams spending more money to win league points. Last year there were eight sides whose payroll costs per point exceeded $100k. This year there were 12. However, after adjusting for inflation, just eight teams were spending more than the average 2007 MLS team to win a league point. Of those eight, only two made the playoffs (LAFC and NYCFC).
- Atlanta United’s payroll cost per point has risen with the league trend in payroll spending and continues to lie in the middle third of the league table. The Five Stripes have had Josef Martínez available and playing in almost all league matches, which has helped boost the payroll utilization ratio to 67%, the second-highest in the league (Chicago Fire). That ratio has increased the usable payroll of the team, but the near record point total has kept the inflation-adjusted win cost stable.
- The bottom fell out of the bottom three teams in the Front-Office Efficiency list, but for different reasons. Toronto FC had the injuries to their defensive back line, but that line is not as well paid as the trident of Bradley, Altidore, and Giovinco, which kept the usable payroll and ultimately the payroll cost extremely high. Chicago Fire also spent a lot of money for their roster, but continued to get very little out of it. San Jose got even less than what they paid for.
- It has been a season in which payroll was more predictive of regular season performance than before, but when adjusted for inflation, the average payroll cost to win a league point is within 1-2% of the cost at the start of the Designated Player era.
The Front-Office Efficiency infographic is shown below. I have not yet placed an updated table of costs per point in real US dollars and standardized win costs in the ProjectData repository on GitHub, but it will be there very shortly.