Have MLS front offices become more efficient over time?
Categories: Front-Office Efficiency
With all of the caveats over player salaries as published by the MLS Players Union, thanks to these data it’s possible to ask whether MLS front offices have become more efficient in talent selection over time.
Since the start of the Designated Player rule in MLS in 2007, teams in the league have seen varying levels of success. A few clubs were able to integrate their expensive Designated Players successfully into the squad (e.g. Guillermo Barros Schelotto), others had no idea what they were doing, and some figured it out after making better choices in on-field management and recruitment of supporting talent (e.g. Los Angeles Galaxy).
But are MLS clubs on average being more efficient in terms of payroll/performance ratio?
The figure below shows the average standard front-office efficiency over the Designated Player era. As explained in the post on standard win cost, the metric is scaled so that the average cost in the baseline year is 100. In the first half of the period — the years 2008 to 2010 — the average standard win cost experiences a rise (due primarily, but not entirely, to the LA Galaxy’s payroll turmoil in David Beckham’s first year with the club) followed by a steep drop to the point where the average cost of winning league points is 20% of the average in 2007 when adjusted for inflation. In the second half of the period — the years 2011 to 2014 — the gains in efficiency are reversed, on average. If you look over the entire period, the standard win cost exhibits a slight trend downward, but the slope of the trend is very shallow. So there is some very limited evidence for an improvement in (averaged) front-office efficiency in MLS since the start of the Designated Player rule, but the evidence isn’t definitive.
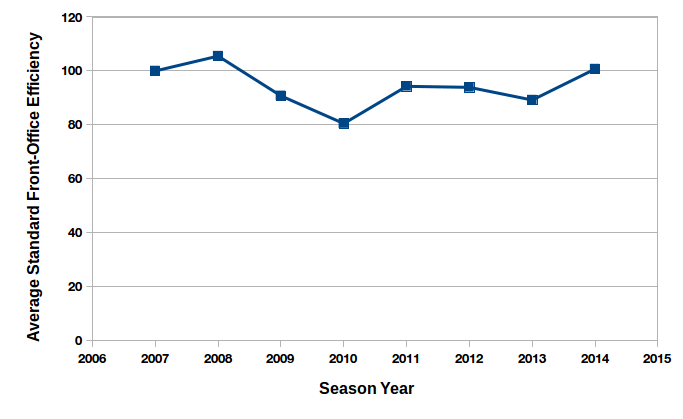
Averaged standard front-office efficiency in Major League Soccer, relative to average efficiency in 2007 (base = 100).
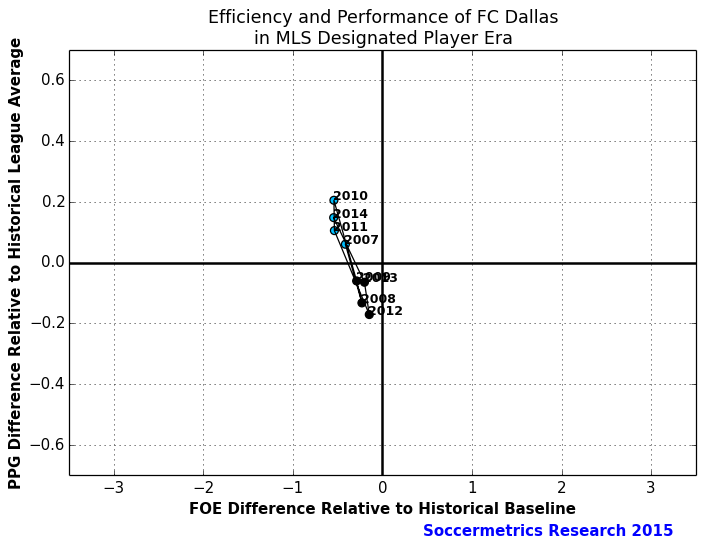
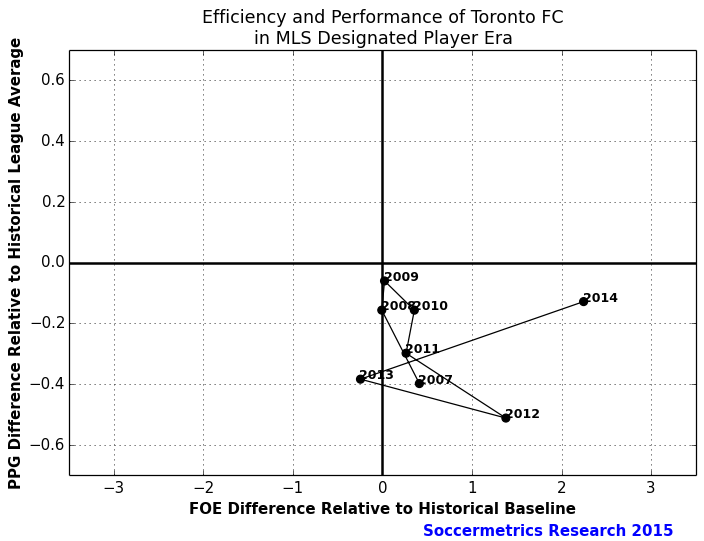
How do individual clubs rate in terms of efficiency? Or to put it another way, how do relative changes in efficiency and performance evolve over time? To examine the question we plot standardized cost and points per game relative to their respective historical baselines — the historical baseline for standardized cost is the league average in 2007 (100.0), and the baseline for points per game is the league average between 2007 and 2014 (1.383). We re-scale both quantities like this so that the plot has a zero origin, which we believe makes any insight gained from the plot easier to communicate. The result is that we have the following regions that can be interpreted accordingly:
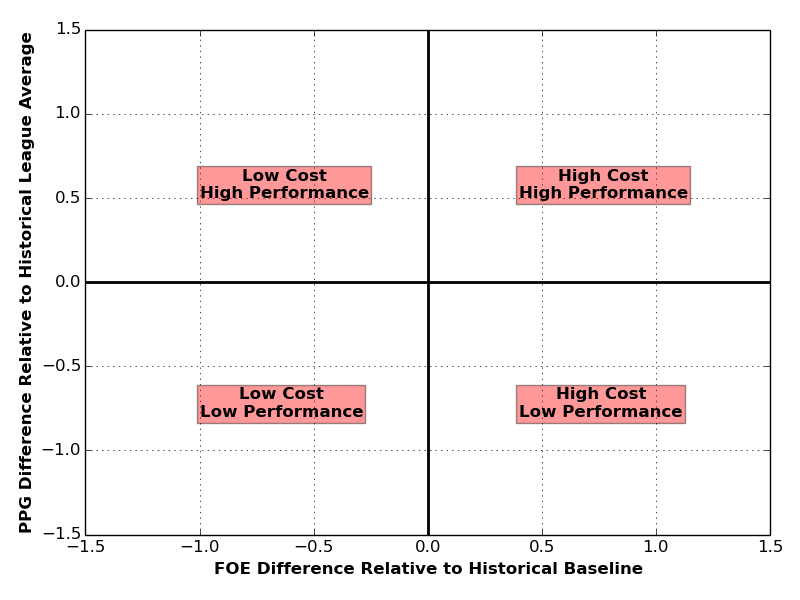
While the top left region is where everyone aspires to be, some clubs can afford to pay more for talent that allows them the best chance of winning a championship. Low cost/low performance is not too surprising a result — you get what you pay for — while a large payroll and poor performance indicates something seriously wrong with team management.
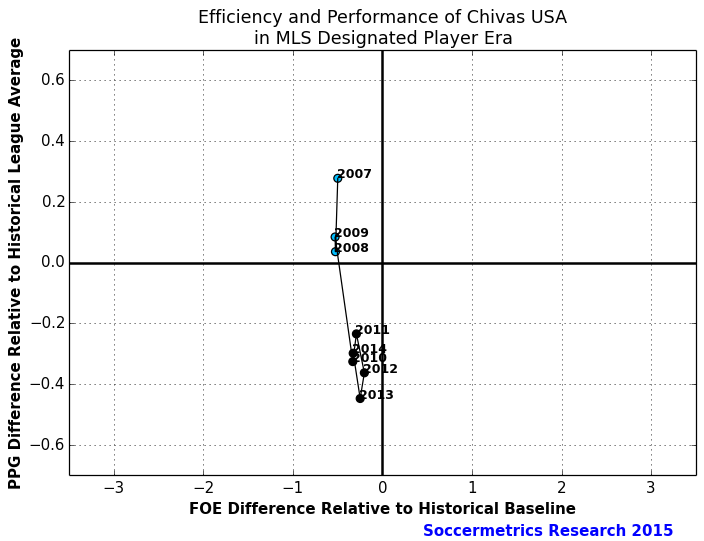
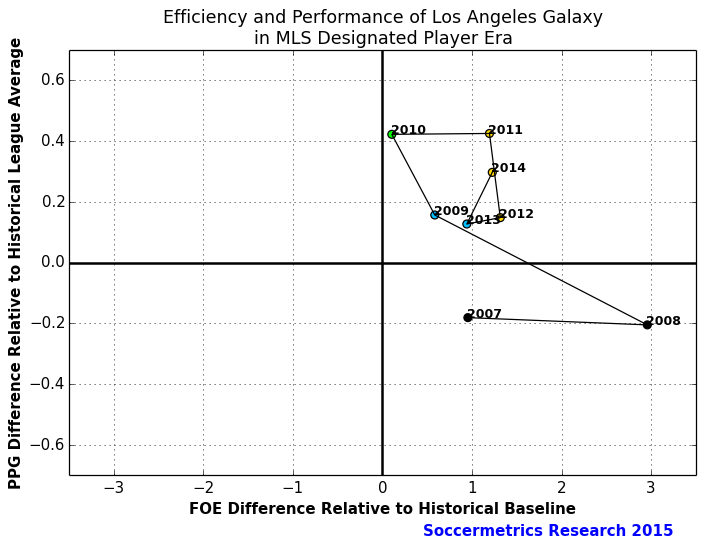
The efficiency/performance data points are plotted as circles that are filled in with various colors to represent the highest end-of-season status of the MLS side: No Playoffs, Playoffs, Supporters Shield, or MLS Cup Winner. If a team wins Supporters Shield and MLS Cup, then the MLS Cup color is used.
| Color | End-of-Season Result |
| Black | No Playoffs |
| Blue | Playoffs |
| Green | Supporters’ Shield |
| Gold | MLS Cup Winner |
So here are some plots. First up is Chivas USA, who were a top six side in the regular season between 2007 and 2009 and were the better team in Los Angeles for a short period but fell away sharply after 2009:
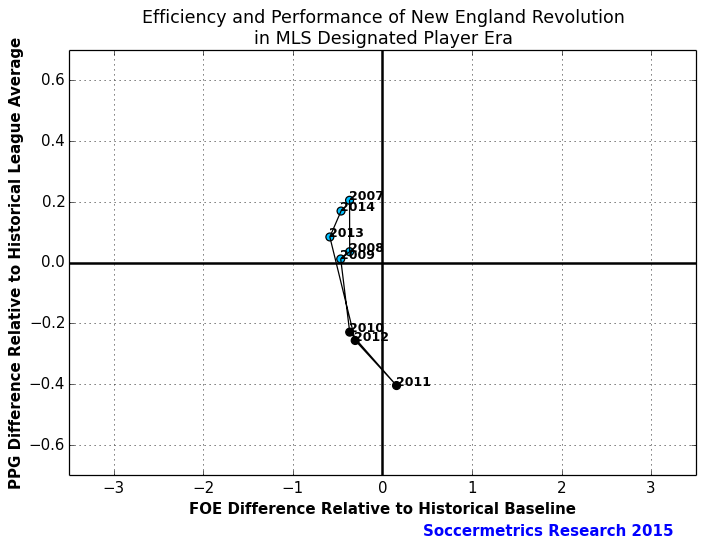
Next is New England Revolution, who after reaching the peak of a MLS Cup final in 2007, regressed, hit bottom in 2011, and started a rebuilding process that ended in another MLS Cup final appearance:
FC Dallas is another example of a team that goes through cycles in performance and expenditure:
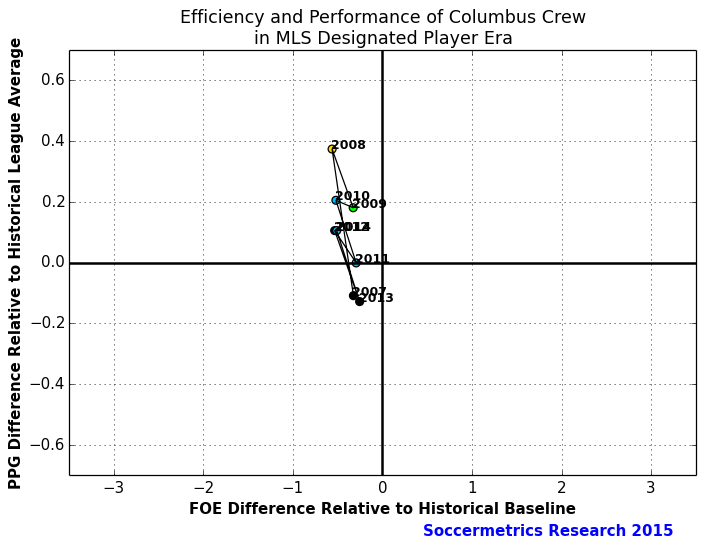
The cost/performance trajectories of most of the Major League Soccer sides fell in the left hand side of the graph. Here’s an example of a side that finished as MLS Cup champion in Columbus Crew:
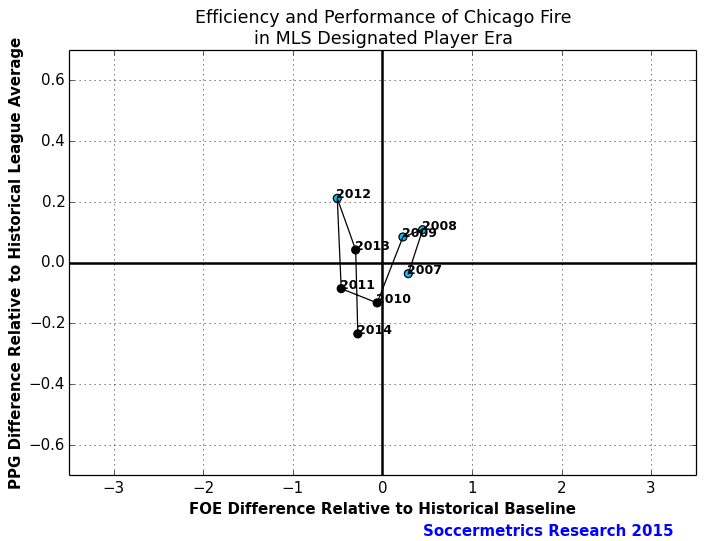
There were a few teams that attempted to implement a high cost/high performance strategy. Chicago Fire had such a strategy for a while:
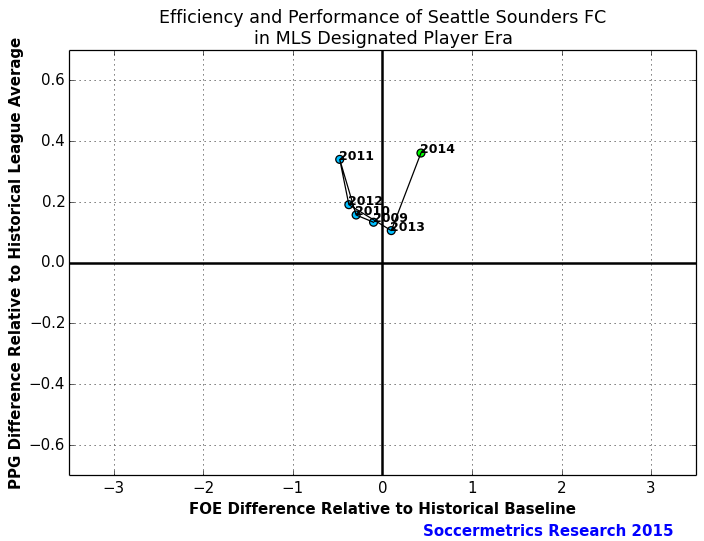
Seattle Sounders started out with a revenue efficient model and transitioned to a resource-rich strategy. They have remained a consistent playoff participant during that period.
Toronto FC may not have always had a high payroll over the course of their history, but they have consistently gained little from the money that they did spend.
The lone club in MLS to have successfully and consistently embarked upon a resource-rich/high-performance path has been Los Angeles Galaxy. Note that in the first two years of the Designated Player era it was not an easy path:
That’s enough plots to give an idea of the cost/performance behavior of MLS clubs over time. We have plots for all 19 MLS sides in the Designated Player era, and we’ll post them to our Twitter feed this week.
It is apparent that most of the MLS sides keep modest payrolls, even when one considers Designated Players and adjusts for inflation. (We’ll put to one side the uncertainty apparent in the Players Union salary totals for now.) Resource-rich strategies can only be afforded by a minority of the clubs, and a minority of players at these clubs are impacted by such a strategy. Player management under such a regime is such a challenge that it shouldn’t be a surprise that only one such club has managed to win MLS Cup. It remains to be seen whether such a situation persists this season or the next few seasons.
