Front-office efficiency in MLS: 2012 edition
Categories: Front-Office Efficiency
Last year I wrote a series of posts that sought to find out the marginal payroll costs per point earned in Major League Soccer. This year I repeat the same analysis for the just-concluded 2012 regular season.
As was the case last year, I calculated team payrolls using player base salary data from the MLS Players Union website, and used total points won over the 2012 MLS season. Instead of setting the payroll/performance baseline to arbitrary values, I set them to the mean of those values minus three times the standard deviation, excluding the payroll/performance of the New York Red Bulls and Los Angeles Galaxy. I did this because the payroll figures of the Red Bulls and Galaxy were at least two sigma out from the rest of the league payroll and as a result distorted the payroll average. The resulting payroll/performance baseline was $891,317.82 and 8 points.
The marginal payroll cost-per-point ratio is the difference between the total payroll and its baseline, divided by the difference between league points and the baseline total. “Front office efficiency” then relates the marginal cost to the league median cost per point.
Below I present the marginal payroll costs of MLS teams in the 2012 season, ranked by front office efficiency gain. The league median cost per point is $70,346.01, so marginal costs below that amount are considered positive and costs above it are negative.
| Team | Payroll | Points | Payroll Cost/Point | Efficiency |
| San Jose Earthquakes | $2,878,166.29 | 66 | $34,256.01 | 51.30% |
| Sporting Kansas City | $2,893,657.00 | 63 | $36,406.17 | 48.25% |
| Houston Dynamo | $2,901,166.04 | 53 | $44,663.29 | 36.51% |
| Real Salt Lake | $3,206,785.04 | 57 | $47,254.43 | 32.83% |
| Columbus Crew | $3,111,134.00 | 52 | $50,450.37 | 28.28% |
| D.C. United | $3,453,679.20 | 58 | $51,247.23 | 27.15% |
| New England Revolution | $2,284,905.96 | 35 | $51,614.38 | 26.63% |
| Chicago Fire | $3,600,214.00 | 57 | $55,283.60 | 21.41% |
| Seattle Sounders FC | $3,789,781.00 | 56 | $60,384.65 | 14.16% |
| Philadelphia Union | $2,861,006.08 | 36 | $70,346.01 | 0.00% |
| Montreal Impact | $3,453,853.00 | 42 | $75,368.68 | -7.14% |
| Colorado Rapids | $3,111,123.00 | 37 | $76,545.01 | -8.81% |
| Chivas USA | $3,047,728.00 | 30 | $98,018.64 | -39.34% |
| Vancouver Whitecaps FC | $4,551,665.00 | 43 | $104,581.35 | -48.67% |
| Portland Timbers | $3,776,116.04 | 34 | $110,953.78 | -57.73% |
| FC Dallas | $4,865,549.04 | 39 | $128,201.01 | -82.24% |
| Los Angeles Galaxy | $10,825,821.00 | 54 | $215,967.46 | -207.01% |
| New York Red Bulls | $15,814,369.46 | 57 | $304,552.07 | -332.93% |
| Toronto FC | $5,829,467.00 | 23 | $329,209.95 | -367.99% |
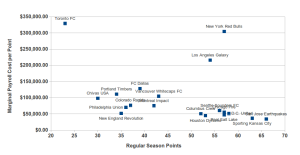
Here is how the marginal payroll cost vs performance chart looks in a different way:
We end up seeing two groups of teams — those with very high payrolls and those whose payrolls are very similar. Most payrolls in Major League Soccer are between $2-4 million (Vancouver and FC Dallas are a little higher, and Toronto FC, LA Galaxy, and NY Red Bulls are a lot higher), so in that group there is an inverse relationship between marginal payroll cost/point and total league points. It’s just about impossible for the Galaxy and the Red Bulls not to be viewed as inefficient under this metric. The team that really stands out, however, is Toronto FC, with their large payroll and very poor performance over the regular season.
I am sure that we will receive emails and phone calls from league officials protesting that (a) the salary figures from the Players Union aren’t all that accurate, and (b) this metric doesn’t take into account player availability throughout the season. The first point is acknowledged, but true salary data is hard to get, at least openly. The second point is a very good one, and it’s one that we hope to address in a future post.
UPDATE: In the original post, I missed an entry for Montreal Impact. I’ve corrected the text, table, and image above.


